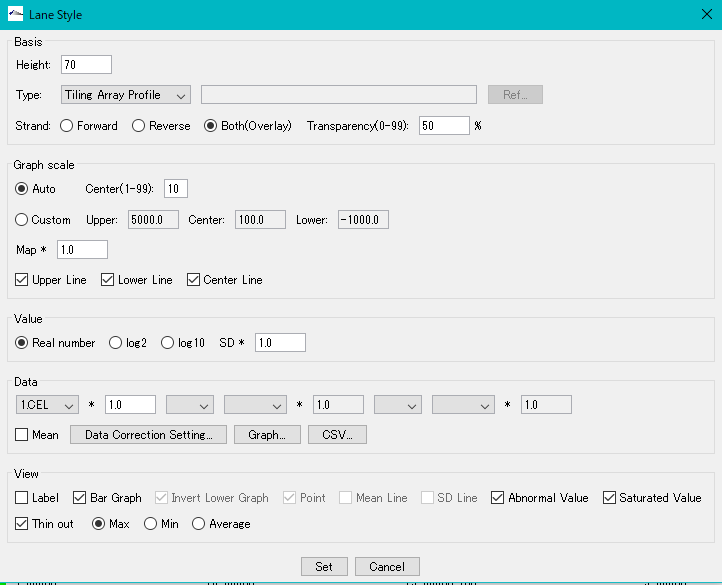
Expression profile Lane style setting dialog. It can be set independently for each lane.
Basis section:
Height text field: Enter the height of the lane as a positive integer value. The unit is pixel.Height text field: Enter the height of the lane as a positive integer value. The unit is pixel.
Type pull-down menu: Select the format of the data. There are two types, Tiling Array Profile and Import Array Data.
Type text field: When Import Array Data is selected, enter the full path of the file storage location.
Rel ... button: Button for starting the file selection dialog.
Strand Forward radio button: When on, only data on the Forward strand will be displayed.
Strand Reverse radio button: When on, only data on Reverse strand is displayed.
Strand Both (Overlay) radio button: When on, data on both strands are overlapped and displayed.
Strand Transparency (0-99) Text field: Specify the transparency of the data to be overlaid. Enter an integer from 0 to 99.
Graph Scale section
Auto radio button: When on, sets the maximum value and minimum value of data in the display range to the upper and lower limit values of the display area.
Center (1-99) Text field: Enter the center line as the distance ratio from the lower limit value to the lane height. Enter an integer from 1 to 99.
Custom radio button: When on, the upper limit, lower limit, and median of the lane can be specified as arbitrary numerical values.
Upper text field: Enter the upper limit value of the lane as a real number.
Center text field: Enter the center line of the lane as a real number.
Lower text field: Enter the lower limit value of the lane as a real number.
Map * Text field: Multiply the profile value displayed on the lane by the entered value. Enter a real number greater than zero.
Upper Line check box: When checked, the upper line of the lane will be displayed.
Lower Line check box: When checked, displays the lower limit line of the lane.
Center Line check box: If checked, displays the center line of the lane.
Value section
Read Number radio button: When on, the expression level is displayed as it is.
Log 2 radio button: When on, the expression level is displayed in base 2 logarithm.
Log 10 Radio Button: When on, displays the expression level in base 10 logarithm.
SD * text field: Enter the coefficient multiplied by the standard deviation as a positive real number.
Data section
Define operations between up to three data series and display the value of the calculation formula.
Section 1 pull-down menu: b Select from the list of loaded array data.
* First term coefficient text field: First term Enter the coefficient multiplied by the data series as a real number.
Operator between 1st and 2nd terms pull-down menu: Select the first term data series and second term data series operators.
Section 2 pull-down menu: Select from the list of loaded array data.
* 2nd coefficient coefficient text field: 2nd term Enter the coefficient multiplied by the data series as a real number.
From 2nd to 3rd operators Operator pull-down menu: Select the first term data series and second term data series operators.
Paragraph 3 Pull-down menu: Select from the list of loaded array data.
* Paragraph 3 Coefficient text field: First term Enter the coefficient multiplied by the data series as a real number.
Mean check box: If checked, the operator setting in the above expression is ignored and the average value of the selected series is displayed.
Data Correction Setting ... Pull-down menu: Sets the data correction method for the value of the equation.
Graph ... button: Displays the value of an arithmetic expression as a histogram.
CSV ... button: Save the value of the formula as a CSV format file.
View section
Label check box: If checked, displays the data series file name as a label.
Bar check box: When checked, a bar graph will be displayed.
Invert Lower Graph checkbox: Selectable when Strand of Basic section is Reverse. When checked, the maximum and minimum values are displayed in reverse.
Point checkbox: Points to each value of the data series.
Mean Line check box: If checked, connect the average value of the data series with a polygonal line.
SD Line check box: When checked, connect the standard deviation of the data series with a polygonal line.
Abnormal Value check box: If checked, it will be displayed including abnormal values.
Saturated Value check box: When checked, displays saturated value.
Thin Out check box: When checked, it will make one graph rendered on the same pixel.
Max radio button: When on, displays the maximum value among the values drawn on the same pixel.
Min radio button: When on, displays the minimum value among the values drawn on the same pixel.
Average radio button: When on, displays the average value of the values drawn on the same pixel.
Set button: Confirms the change contents.
Cancel button: Cancel the setting contents.
.