


Expression Clustering
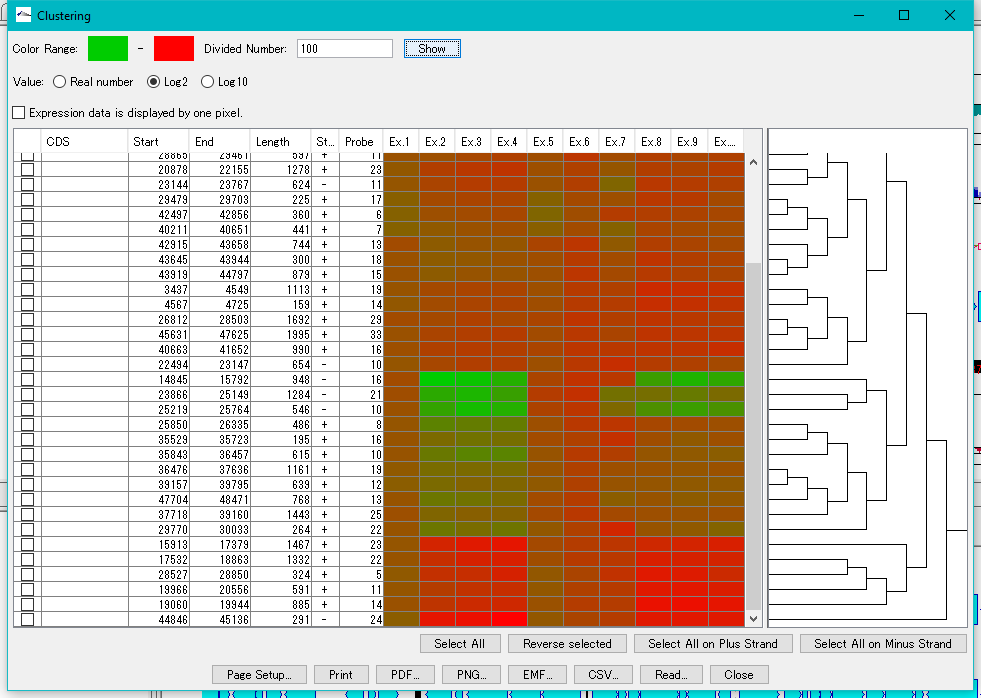
Clustering of gene expression levels.
Clustering results can be displayed as dendrograms and heat maps.
This function can be executed with the following edition.
AE , DS
, DS , GT
, GT
Select your language



 License Activation
 Function Overviews and Basic Operation
 Work Bench
 Feature Map
 Sequence and Data Input and Output
 Search Sequence and Annotation
 Genome Comparison
 Settings
Clustering of gene expression levels.
Clustering results can be displayed as dendrograms and heat maps.
This function can be executed with the following edition.
AE, DS, GT