Function Menu
 License Activation
 Function Overviews and Basic Operation
 Work Bench
 Feature Map
- Feature Key and Feature
 Management and Operations of Feature Keys
- Attributes of Feature Keys
- IMC Original Set Feature Keys
- Types and Roles of Qualifiers
- IMC Original Set Qualifiers
- View and Edit Qualifiers
- Feature Position on Genome Sequence
- Feature Fragmentation
- Feature Synthesis
- Feature Fusion
- Feature Operators
- Link and Refer on Feature
- Feature Mapping
- Register, Edit, Delete Feature
- Feature Appearance
- Join and Delete Position
- Feature Categorization and Presentation
- Import Feature
- Export Feature
- Numbering of Feature
 Sequence and Data Input and Output
- Genome / Sequence Viewer / Editor
 GenBank EMBL Viewer
 Sequence Viewer
 Annotation Viewer
- Multiple Genome Viewer (Linear Map)
 Circular Genome Viewer-Designer
 Plasmid Map Viewer-Designer
 Trace Viewer - Editor
- Labeling and Coloring
- Description Window
- Amino Acid Sequence Profile Viewer
- Multiple Alignment Viewer
 Phylogenetic Tree Viewer
- GT Alignment Viewer
- Restriction Enzyme Map Window
 Search Sequence and Annotation
- Cloning
- Sequencing
- Gene and Genome Sequence Analysis
- Genome Annotation
 Genome Comparison
- Multiple Aligment
- Phylogenetic Tree
- Multiple Linear Genome Map
- Gene Cluster Alignment
 Multiple Circular Genome Map
 Dot Plot Analysis
 Venn Diagram Analysis
- Core Genome Analysis
- Global Genome Rearrangement Analysis
- Local Genome Rearrangement Analysis
- Mutation Analysis
- Enzyme Alignment by EC Number
- Unique Region Analysis
- Genome Mapping
- Expression Analysis
- Metabolome Analysis
- Genome Design
 Settings
- Tools
- Window and Dialog Description
- What is "Do It Yourself" Genome Analysis Software?
- Functions and Operations of GenomeTraveler
 Dongle License (HW Key)
 Feature Key Search
 Keyword Search
 Pattern Search
 Priming Site Search
 Batch Homology Search
 Restriction Enzyme
 Primer Design
 PCR Reaction
 Ligation
 Fragment Modification
 DNA Content Analysis
 Codon Analysis
 ORF Analysis
 Database Management
 Reverse Complement
Local Genome Rearrangement Analysis
What is a local genome rearrangement map?
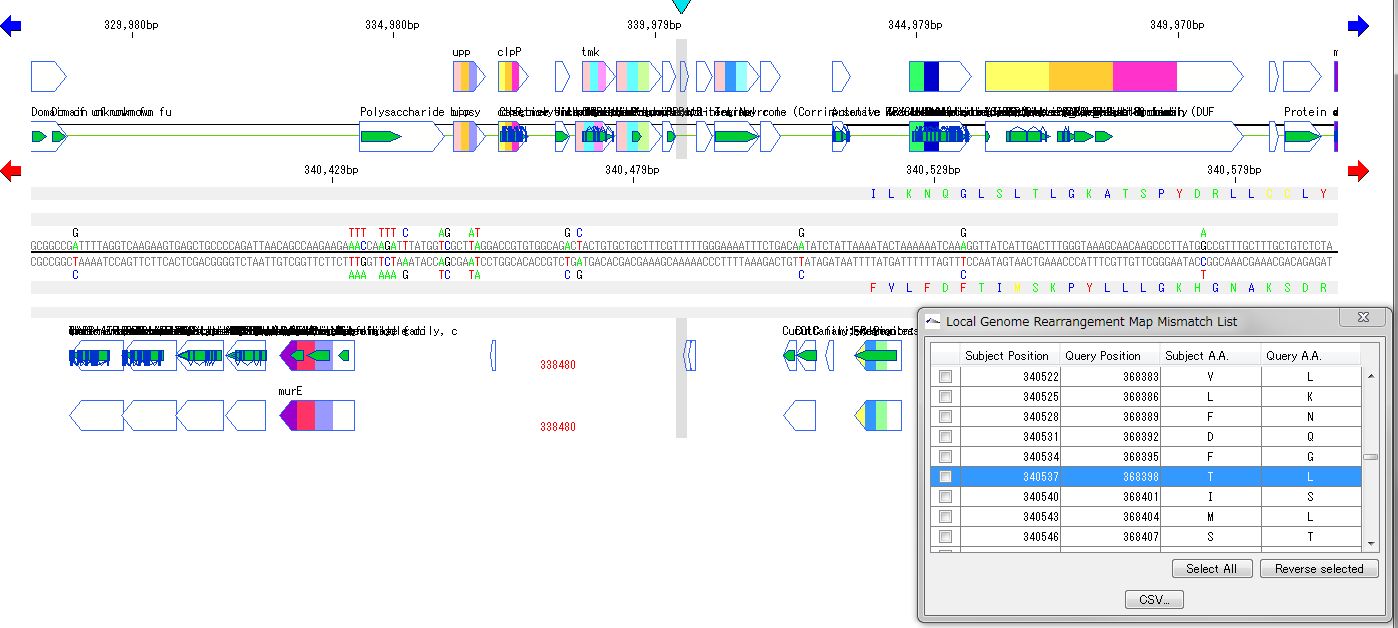
The local genome rearrangement map (Local Genome Rearrangement Map) is one of the functions to compare closely related species. A comparison of homology regions along the maximum homology path between two genomes is displayed at the base sequence and amino acid sequence level and annotations on those genomes are displayed.
Features
Detect homologous regions with different closely related genomes on the reference genome and draw a local genomic rearrangement map in which the nucleotide sequence and the features of each genome are aligned. I call this function the local genome rearrangement map.
We create and draw a local genomic rearrangement map across the two closely related species.
For the reference genome, we map the entire genomes of closely related species to be compared.
It displays the homologous region at the base sequence level throughout the genome between the two genomes.
In the coding region, corresponding amino acid residues are aligned.
You can move the map to the corresponding position by listing the mismatch points of amino acid residues and clicking on each mismatch point in the list.
A list of coincident parts and residues can be output as a CSV file.
The list will be reproduced and displayed when reloading.
In the homologous region, the features of both genomes and their positions are aligned.
For regions where there is no homology with the reference genome, the features of the comparison genome will not be displayed.
This is judged from the principle that the LGRM maps the comparison genome to the reference genome, as a region which is not mapped, that is, a region deleted from the comparison target genome.
Analysis results can be saved and re-browsed as GenBank format files of the reference genome.
LGRM display setting can be registered as layout style (LGRM lane).
The LGR Map lane can be placed at any position in the main feature map.
You can customize comparison display of base sequence and amino acid sequence
LGRM reads ordinary array lane for LGRM and uses it.