Function Menu
 License Activation
 Function Overviews and Basic Operation
 Work Bench
 Feature Map
- Feature Key and Feature
 Management and Operations of Feature Keys
- Attributes of Feature Keys
- IMC Original Set Feature Keys
- Types and Roles of Qualifiers
- IMC Original Set Qualifiers
- View and Edit Qualifiers
- Feature Position on Genome Sequence
- Feature Fragmentation
- Feature Synthesis
- Feature Fusion
- Feature Operators
- Link and Refer on Feature
- Feature Mapping
- Register, Edit, Delete Feature
- Feature Appearance
- Join and Delete Position
- Feature Categorization and Presentation
- Import Feature
- Export Feature
- Numbering of Feature
 Sequence and Data Input and Output
- Genome / Sequence Viewer / Editor
 GenBank EMBL Viewer
 Sequence Viewer
 Annotation Viewer
- Multiple Genome Viewer (Linear Map)
 Circular Genome Viewer-Designer
 Plasmid Map Viewer-Designer
 Trace Viewer - Editor
- Labeling and Coloring
- Description Window
- Amino Acid Sequence Profile Viewer
- Multiple Alignment Viewer
 Phylogenetic Tree Viewer
- GT Alignment Viewer
- Restriction Enzyme Map Window
 Search Sequence and Annotation
- Cloning
- Sequencing
- Gene and Genome Sequence Analysis
- Genome Annotation
 Genome Comparison
- Multiple Aligment
- Phylogenetic Tree
- Multiple Linear Genome Map
- Gene Cluster Alignment
 Multiple Circular Genome Map
 Dot Plot Analysis
 Venn Diagram Analysis
- Core Genome Analysis
- Global Genome Rearrangement Analysis
- Local Genome Rearrangement Analysis
- Mutation Analysis
- Enzyme Alignment by EC Number
- Unique Region Analysis
- Genome Mapping
- Expression Analysis
- Metabolome Analysis
- Genome Design
 Settings
- Tools
- Window and Dialog Description
- What is "Do It Yourself" Genome Analysis Software?
- Functions and Operations of GenomeTraveler
 Dongle License (HW Key)
 Feature Key Search
 Keyword Search
 Pattern Search
 Priming Site Search
 Batch Homology Search
 Restriction Enzyme
 Primer Design
 PCR Reaction
 Ligation
 Fragment Modification
 DNA Content Analysis
 Codon Analysis
 ORF Analysis
 Database Management
 Reverse Complement
Genome Comparison
 |
|
Subcategories
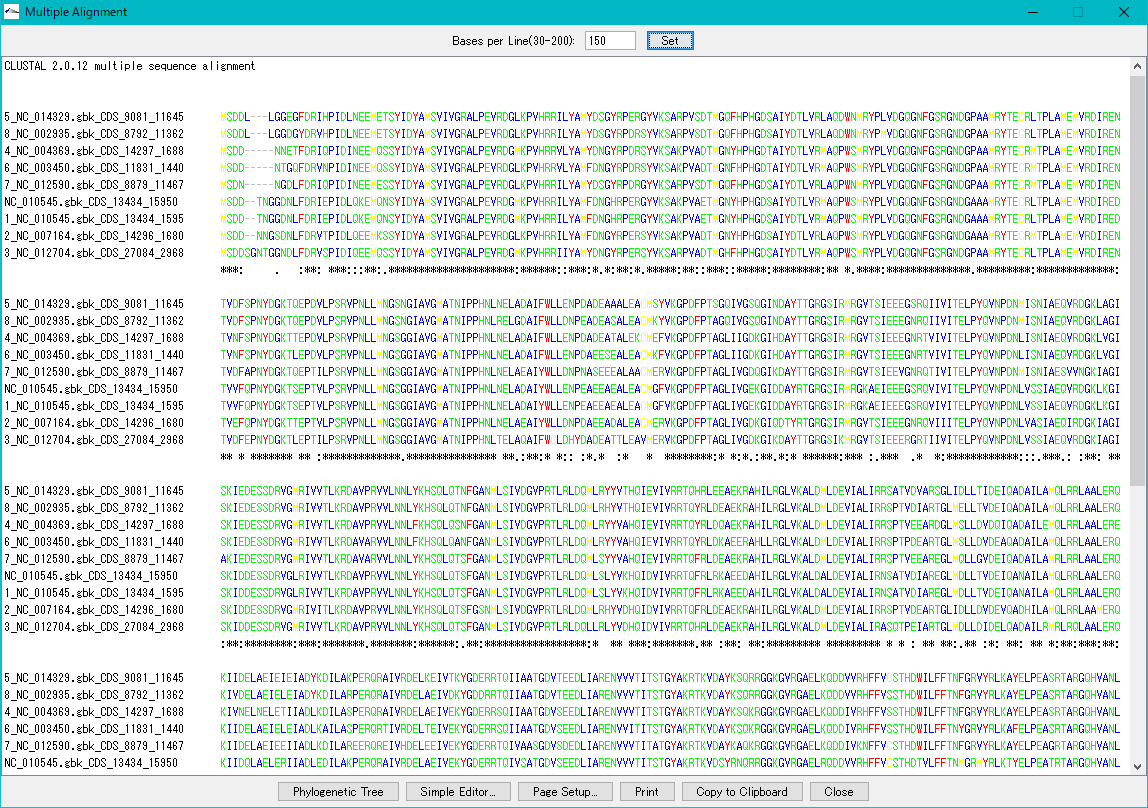
Multiple Aligment 0
Make an alignment between multiple nucleic acid or amino acid sequences.
Multiple selections are possible from the sequence loaded in the main current directory.
You can also activate this function from the homology search result screen.
From the result dialog, it is possible to perform phylogenetic tree drawing function, simple editor function, copy to clipboard, print.
You can change the number of characters displayed per line.
Multiple Circular Genome Map 4
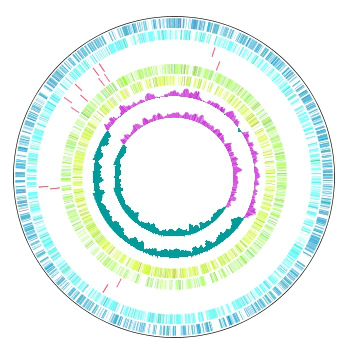 |
Function to draw the feature and the composition of more than one related species genome in parallel on the concentric-circle. The addendum - the manipulation - a circular lane can be freely deleted from the drawing DIALOG. It is the designation only of the designation feature content imaging order alteration GenomeMap designation assignment feature in the content skew of the judgement of the chromosome base-sequence of more than one designation in the feature of the judgement of the chromosome base-sequence with more than one annotation. Independent color setting by the concentric-circle.
Implemented Editions: |
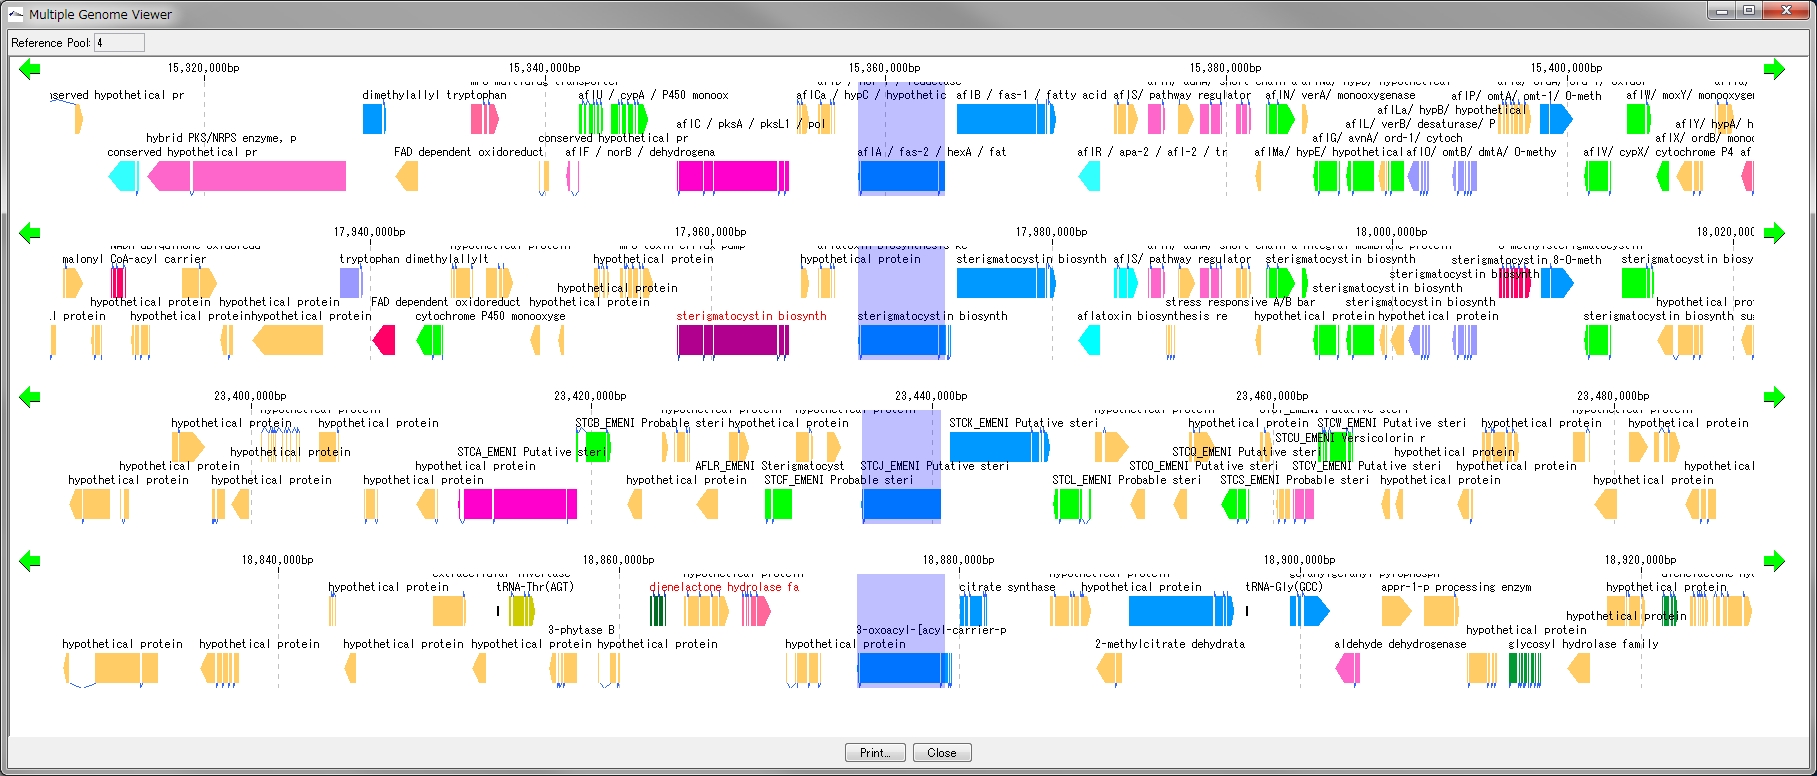
Multiple Linear Genome Map 5
This function is installed in the following software
IMCGE
IMCAE
GenomeTraveler
- Multiple Linear Genome Map (Multiple Linear Genome Map) is a function to comparatively draw Feature from multiple genomic chromosomes between closely related species in parallel.
- Homology search can be performed on all the features on other genomes by right clicking one feature on the multiple linear genomic map and if that feature has homologous clan strings on other genomes, homologous genes Alignment can be displayed on the axis.
- "IMC O10 Gene Cluster Alignment" can be executed by right mouse click from multiple linear map.
- You can output files in PDF, PNG, and EMF image formats.
Dot Plot Analysis 5
- This function is implemented in the following editions.
- IMCGE
 , AE
, AE , DS
, DS , GT
, GT
- IMCGE
- We display homology regions between two genomic sequences in dot matrix.
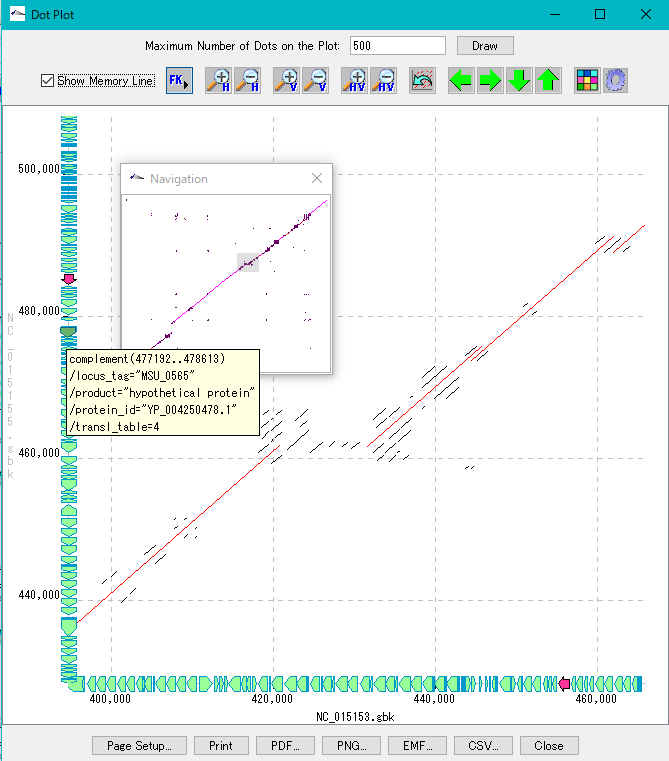
- Select and compare the current genome sequence and one genomic sequence loaded in the current reference directory.
- You can set dot color by Overlap base length,% Identity level.
- In the result display window, zooming, shifting, enlarging an arbitrary region selected by rectangle, dot color setting, navigation window, restriction on the number of display dots, and feature key display (display of annotations with feature - mouse-over) are possible.
- A dot image can be output as a file in PDF / PNG / EMF format, and print setting is also possible.
- The dot list can be output as a file in CSV format.
Venn Diagram Analysis 10
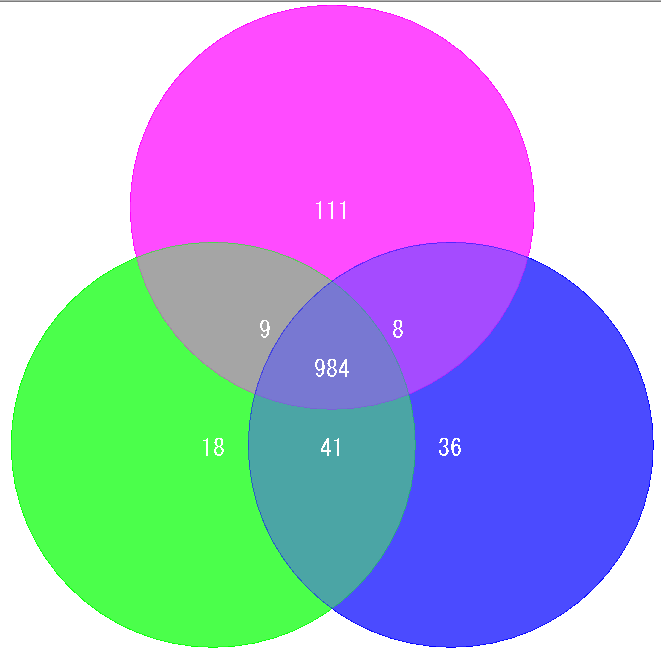
Venn Diagram is a diagram used in set theory, showing the distribution of the number of elements between 3 sets (4 or more sets can be drawn, but IMC draws only 3 sets or less) It is.
Elements belonging to each set are shown in the circle, and overlapping parts are shown as common elements.
It is used for biological applications to illustrate the number of orthologous or unique genes between closely related genomes.
Global Genome Rearrangement Analysis 0
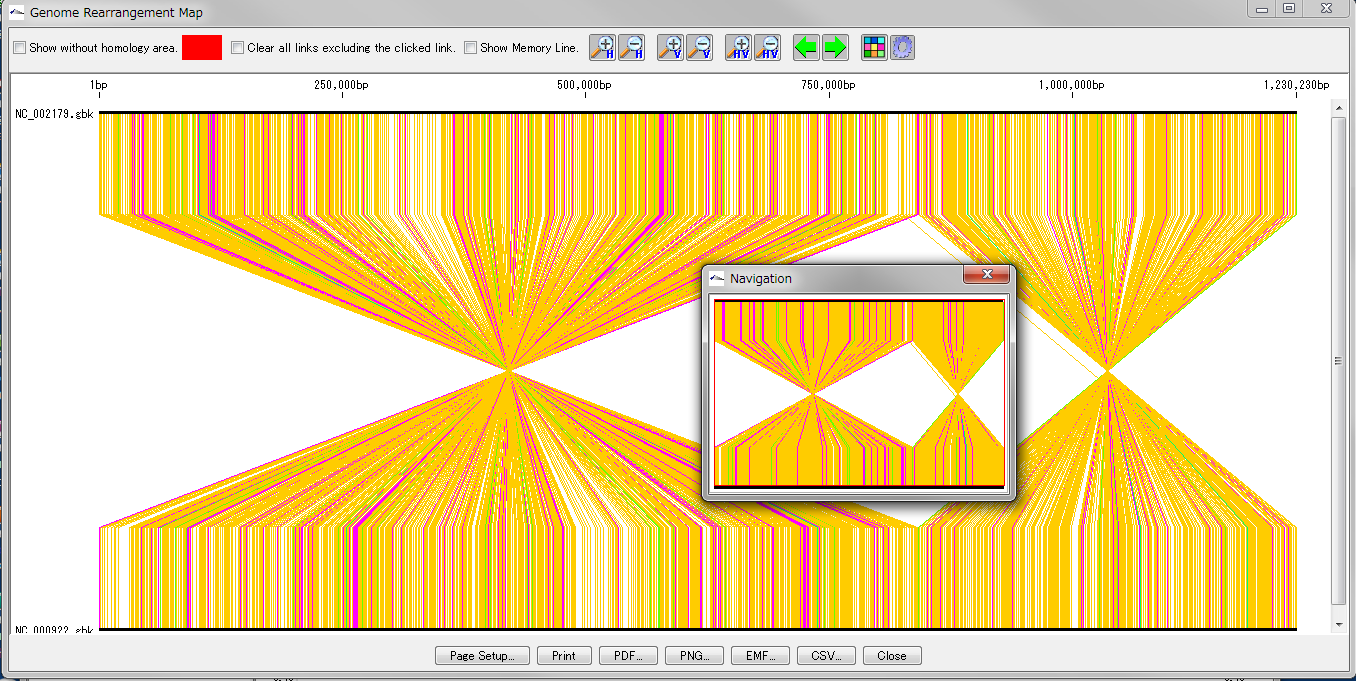
Drawing window for global genome rearrangement map. Genomic sequences that are closely related to each other are represented in a straight line at the top and bottom. Many colored line segments that connect the upper and lower line segments are highly homologous in the upper and lower genomes. The color of the line connecting the top and bottom shows the difference in the strength of homology. The line that gathers at one point in the center indicates that this basin is inverted in each other's genome. A small window in the center shows what is displayed when you zoom in on the whole in the navigation window. Screen display and output can be set with the button tools at the top and bottom.
This feature is implemented in the following software editions
- IMCGEIMCAEIMCDSGenomeTraveler
Overview and functions
Create and draw a genome rearrangement map across the entire length of related species genomes at the feature level.
Compares the total genome length pairwise between the current genome sequence and the selected (several) genome sequences among the related species genome sequences loaded in the current reference directory.
Comparisons with nucleic acid sequences and amino acid sequences are possible. The criteria for determining homology can be changed.
For comparison by amino acid sequence, both genomes must be annotated with CDS.
From the result screen, you can zoom in and out, scroll, pick up homologous lines, display arbitrary feature keys, display non-homologous regions, and display a navigation window.
Result images can be output in PDF / PNG / EMF format. The homology list can be output as a file in CSV format.
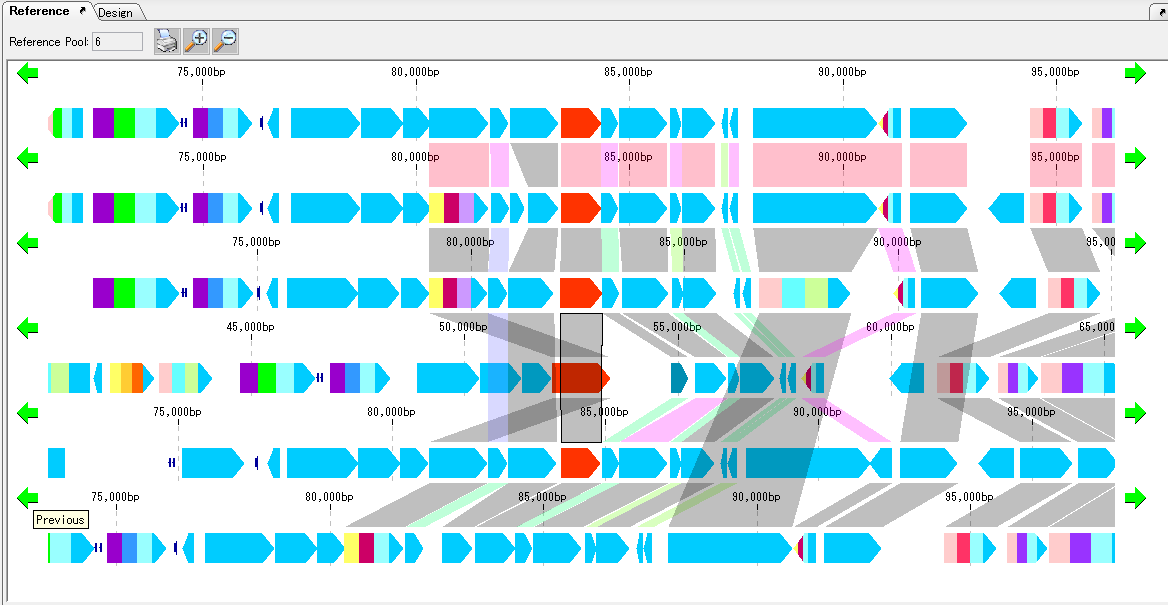
Local Genome Rearrangement Analysis 4
What is a local genome rearrangement map?
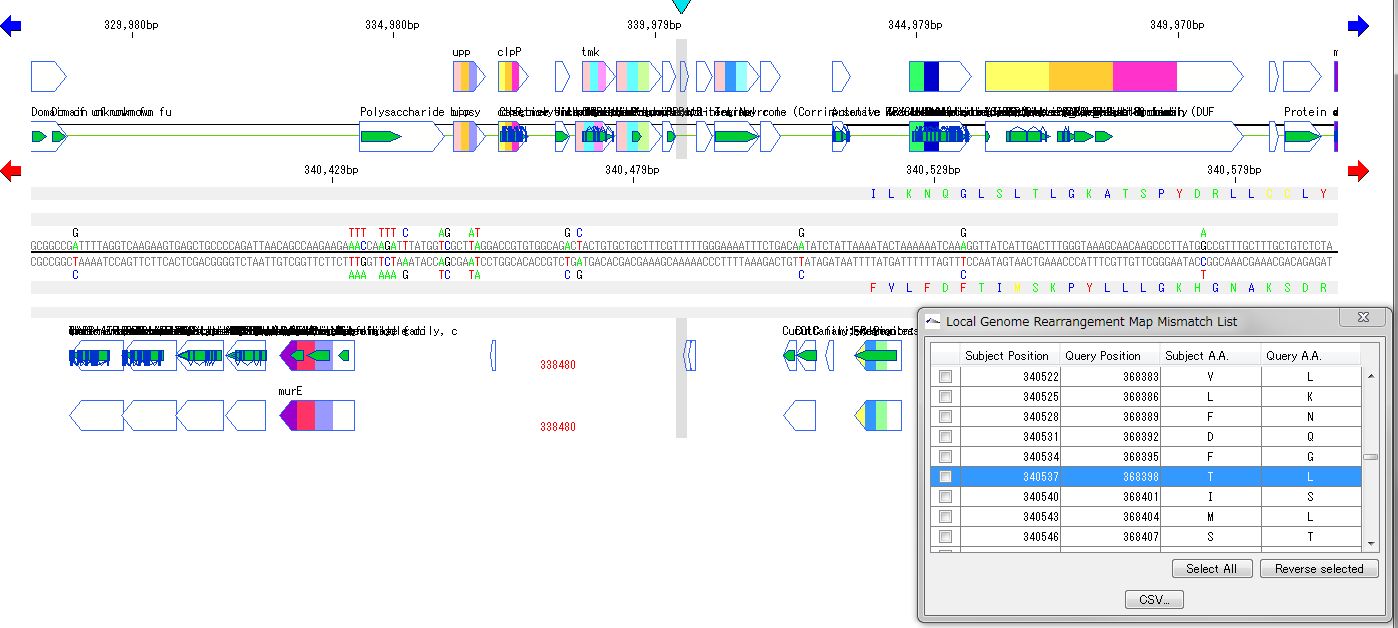
The local genome rearrangement map (Local Genome Rearrangement Map) is one of the functions to compare closely related species. A comparison of homology regions along the maximum homology path between two genomes is displayed at the base sequence and amino acid sequence level and annotations on those genomes are displayed.
Features
Detect homologous regions with different closely related genomes on the reference genome and draw a local genomic rearrangement map in which the nucleotide sequence and the features of each genome are aligned. I call this function the local genome rearrangement map.
We create and draw a local genomic rearrangement map across the two closely related species.
For the reference genome, we map the entire genomes of closely related species to be compared.
It displays the homologous region at the base sequence level throughout the genome between the two genomes.
In the coding region, corresponding amino acid residues are aligned.
You can move the map to the corresponding position by listing the mismatch points of amino acid residues and clicking on each mismatch point in the list.
A list of coincident parts and residues can be output as a CSV file.
The list will be reproduced and displayed when reloading.
In the homologous region, the features of both genomes and their positions are aligned.
For regions where there is no homology with the reference genome, the features of the comparison genome will not be displayed.
This is judged from the principle that the LGRM maps the comparison genome to the reference genome, as a region which is not mapped, that is, a region deleted from the comparison target genome.
Analysis results can be saved and re-browsed as GenBank format files of the reference genome.
LGRM display setting can be registered as layout style (LGRM lane).
The LGR Map lane can be placed at any position in the main feature map.
You can customize comparison display of base sequence and amino acid sequence
LGRM reads ordinary array lane for LGRM and uses it.
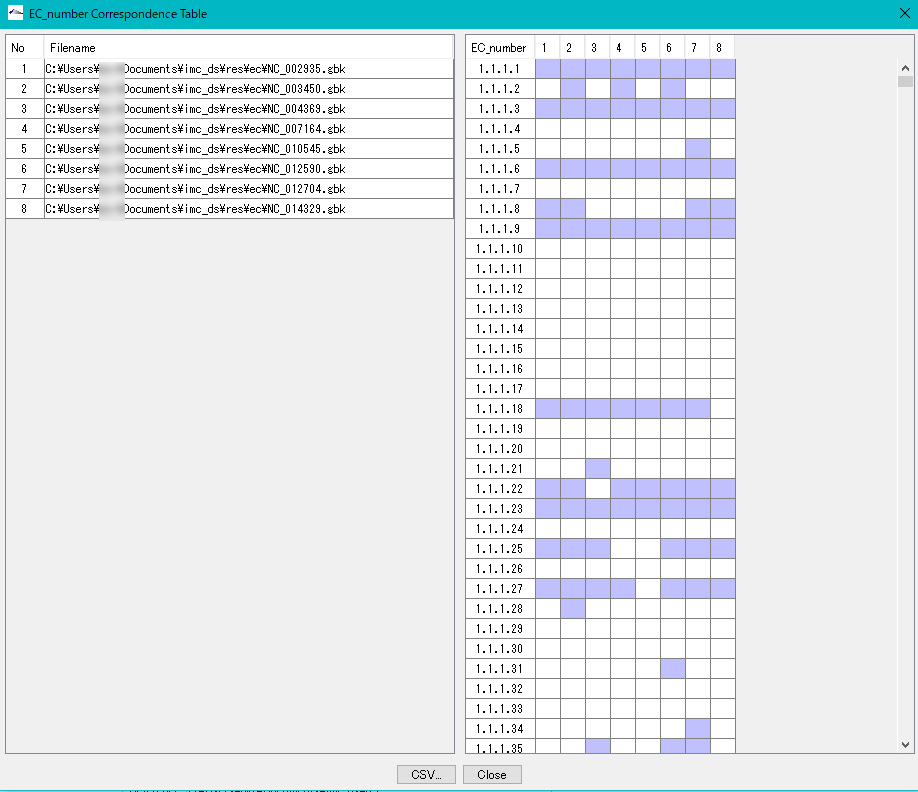
Enzyme Alignment by EC Number 0
Displays a control list of EC numbers annotated to the CDS present in each genome from multiple annotated genomic base sequence files.
- Nucleotide sequences that do not have an EC number added to the annotation can not be analyzed.
- Extract the EC number in Feature of the analysis target file.
- Create an existence list in ascending order of EC numbers.
- Specify two or more GenBank / EMBL format files.
- EC_Number The Correspondence Table window is displayed.
- You can output this content as CSV format file.
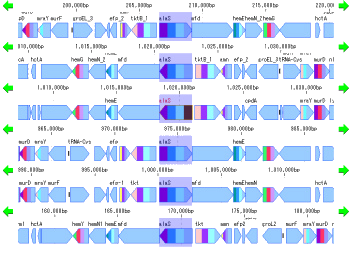
Gene Cluster Alignment 3
Gene cluster alignment focuses on one gene of a plurality of closely related genomes, and includes the vicinity thereof (N gene ranges in the upstream and N gene ranges in the downstream), and the relationship between the closely related species genome
The presence or absence of homology is investigated, and when there is BBH, homologous genes are combined and displayed in bands.
The homology score allows you to change the drawing color of the binding band.
For alignment display, use the reference feature map (multiple genome viewer).
Each genome can be scrolled left and right individually.
It is possible to zoom the whole.
If you change the display order of genome, clustering will end.
To print, use the Print button. You can dock out this pane.
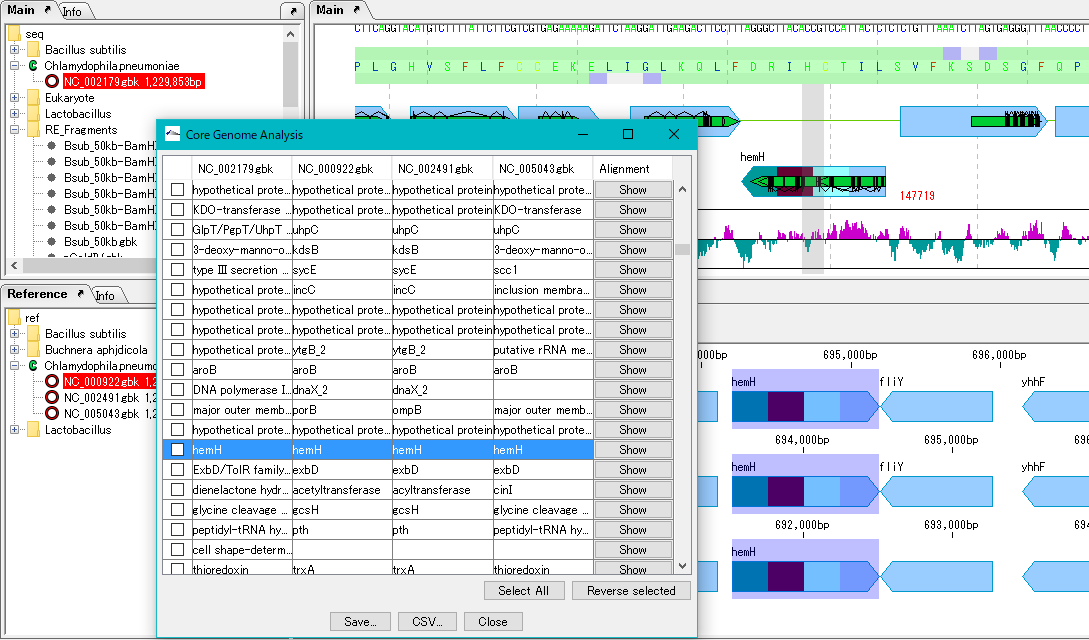
Core Genome Analysis 1
Extract the core genome from the pan genome.
Specifically, common genes are extracted from closely related genomic populations.
It is possible to save analysis results in a file.
Once you have finished IMC, you can load this file and continue the core genome analysis.
Calculation time is required if the group is large.
In that case, we recommend running on a computer with a large number of cores.
Implementation edition: IMCGE![]() , AE
, AE![]() , DS
, DS![]()
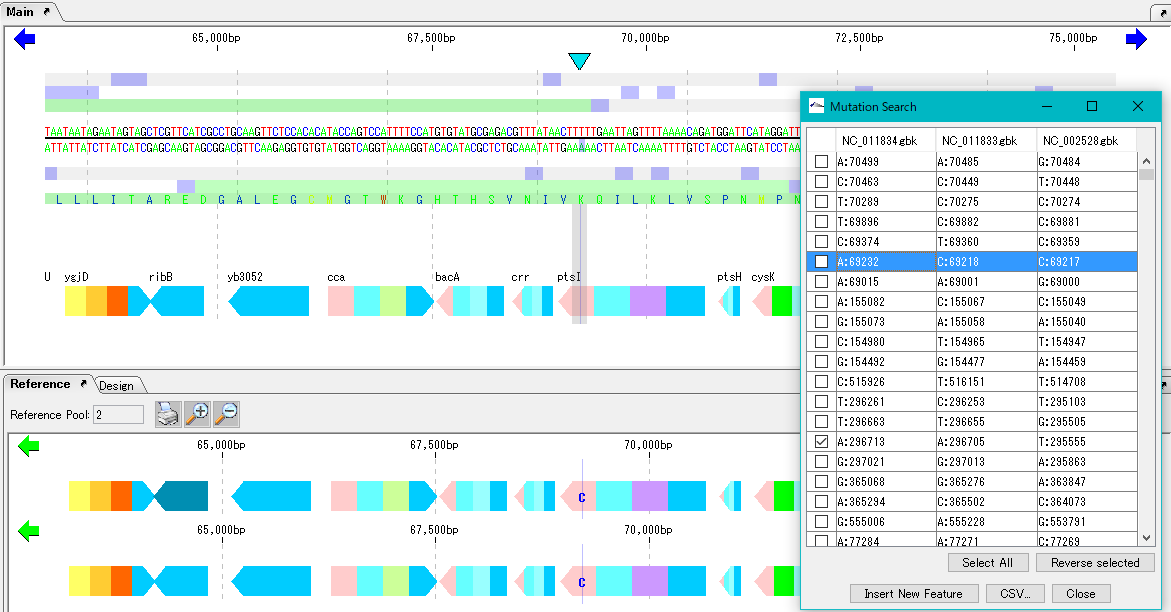
Mutation Search 1
Mutation point analysis detects mutation points between related genomes (pangenomes) in base units.
- Based on the current genome sequence, you can select and compare two or more from the genomic sequence loaded in the current reference directory.
- The genomic sequence must be genetically extracted and the CDS feature must be registered.
- Mutant bases can be displayed on the reference feature map.
- The detection site can be set on CDS or intergenic region.
- In the case of the intergenic region, the accuracy drops.
- For detection criteria, you can change% Identity and Overlap rate.
- A list of mutated bases is displayed on the analysis result screen, and the display items are mutated bases, mutation positions, gene names, ocus-Tags by genome sequence.
- Results can be output in CSV format.
- Increasing the memory size will also increase the analyzable pan genome size.
- Calculation time is required if the group is large. In that case, we recommend running on a computer with a large number of cores.
Implementation edition: IMCGE![]() , AE
, AE![]() , DS
, DS![]()
Phylogenetic Tree 0
From the multiple alignment result, draw the molecular phylogenetic tree of the selected feature.
You can specify horizontal display, vertical display, and rootless tree. It is also possible to show / hide the evolution distance.
You can select the shape of the node from Box, Circle, None.
A phylogenetic tree diagram can be output as a file in PDF format.
You can read and display the phylogenetic tree file (dnd format) created externally.