Function Menu
 License Activation
 Function Overviews and Basic Operation
 Work Bench
 Feature Map
- Feature Key and Feature
 Management and Operations of Feature Keys
- Attributes of Feature Keys
- IMC Original Set Feature Keys
- Types and Roles of Qualifiers
- IMC Original Set Qualifiers
- View and Edit Qualifiers
- Feature Position on Genome Sequence
- Feature Fragmentation
- Feature Synthesis
- Feature Fusion
- Feature Operators
- Link and Refer on Feature
- Feature Mapping
- Register, Edit, Delete Feature
- Feature Appearance
- Join and Delete Position
- Feature Categorization and Presentation
- Import Feature
- Export Feature
- Numbering of Feature
 Sequence and Data Input and Output
- Genome / Sequence Viewer / Editor
 GenBank EMBL Viewer
 Sequence Viewer
 Annotation Viewer
- Multiple Genome Viewer (Linear Map)
 Circular Genome Viewer-Designer
 Plasmid Map Viewer-Designer
 Trace Viewer - Editor
- Labeling and Coloring
- Description Window
- Amino Acid Sequence Profile Viewer
- Multiple Alignment Viewer
 Phylogenetic Tree Viewer
- GT Alignment Viewer
- Restriction Enzyme Map Window
 Search Sequence and Annotation
- Cloning
- Sequencing
- Gene and Genome Sequence Analysis
- Genome Annotation
 Genome Comparison
- Multiple Aligment
- Phylogenetic Tree
- Multiple Linear Genome Map
- Gene Cluster Alignment
 Multiple Circular Genome Map
 Dot Plot Analysis
 Venn Diagram Analysis
- Core Genome Analysis
- Global Genome Rearrangement Analysis
- Local Genome Rearrangement Analysis
- Mutation Analysis
- Enzyme Alignment by EC Number
- Unique Region Analysis
- Genome Mapping
- Expression Analysis
- Metabolome Analysis
- Genome Design
 Settings
- Tools
- Window and Dialog Description
- What is "Do It Yourself" Genome Analysis Software?
- Functions and Operations of GenomeTraveler
 Dongle License (HW Key)
 Feature Key Search
 Keyword Search
 Pattern Search
 Priming Site Search
 Batch Homology Search
 Restriction Enzyme
 Primer Design
 PCR Reaction
 Ligation
 Fragment Modification
 DNA Content Analysis
 Codon Analysis
 ORF Analysis
 Database Management
 Reverse Complement
Category English
Subcategories
Software Products 49
Software products developed and distributed by in silico biology, inc.
License Activation Methods 6
There are two types of activation methods provided by in silico biology.
Software key license (SW key license)
Dongle license (HW key license)
Dongle License (HW Key) 1
It is a license that incorporates an authentication mechanism into USB memory-like hardware (dongle).
The license will be valid on the PC or Mac with the registered dongle inserted.
Product Release News 40
IMC Release News 25
Newest release of IMC (in silico MolecularCloning)
GT Release News 12
Recent release of GenomeTraveler
ISB Products 1
IMC: in silico MolecularCloning 1
IMC Entry Edition 0
This edition is limited to basic functions for students (high school students and undergraduate students).
IMC Standard Edition 0
The Standard Edition includes basic functions for molecular biology research such as homology search, pattern search function, annotation function as well as cloning function.
For details on the functions of the Standard Edition, see the IMC Standard Edition page of eShop in silico.
IMC Array Edition 0
IMC Array Edition is a genomics edition with added gene expression analysis function.
The functionality of the IMC Array Edition is inherited by its successor edition, the IMC Design Suite.
IMC Design Suite 0
This is the top edition of IMC, including genome design functions.
For details on the functions, see the following page.
GT: GenomeTraveler 0
GenomeTraveler is a sequence analysis software for NGS, 3rd GS.
Solution 328
We have published a number of advanced and unique solutions that can be realized using in silico biology's software. It describes how to solve in silico biology products mainly for given tasks.
Function Overviews and Basic Operation 21
|
|
Launch 10
There are the following methods to launch IMC.
- Double click the desktop icon
- Launch from the start menu (Windows)
- Launch from the command prompt (Windows)
- Launch from Terminal (Mac)
Launch IMC 7
There are the following methods to launch IMC.
- Double click the desktop icon
- Launch from the start menu (Windows)
- Launch from the command prompt (Windows)
- Launch from Terminal (Mac)
Launch GT 2
There are the following methods to launch GT.
Double click the desktop icon
Launch from the start menu (Windows)
Launch from the command prompt (Windows)
Launch from Terminal (Mac)
Terminate 5
There are the following ways to terminate IMC.
Normal Termination of IMC
- Select the Exit menu and exit
- Click the "X" button in the main window to exit
- In the case of the above normal termination, the changed various setting parameters are automatically saved.
- Sequences that were being edited in the current sequence directory may be saved automatically, and prompts to save or not may be displayed. You can select this setting in the Feature Setting -> Setup tab pane.
Forced Termination
- Forced termination of IMC (Windows)
- Forced termination of IMC (Mac)
- When forcibly terminating the IMC, the sequences that were in the current sequence directory just before may not be saved. Also, various changed setting parameters may not be saved.
Basic Application Operation 6
The following operations are often used in IMC.
- Load (read) the base sequence file and display the main feature map.
- Perform Keyword Search.
- Find the restriction enzyme recognition site.
- View the sequence from the reverse complement side.
- Perform homology search.
Use IMC for the First Time 0
Please visit when using IMC for the first time.
Use GT for the First Time 5
Please read the following when using GenomeTraveler (GT) for the first time.
Sample data will be installed automatically when GT is started for the first time.
Using this sample data, you can practice the operation.
If sample data is not displayed, confirm the demo directory and change it to the root directory and it will be displayed.
Sample data includes the following.
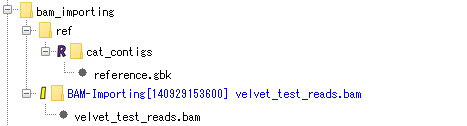
BAM file import:
Contains the result of importing the BAM file used for assembly and mapping. Each fragment of the BAM file can be viewed with the Alignment Viewer.
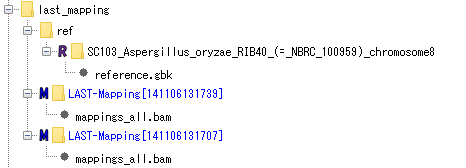
Mapping (using LAST):
The reference genomic data and the result of mapping NGS lead using LAST on its genome are stored. You can browse and analyze the reference genome data by activating the IMC, and you can view and analyze the mapping by starting the Alignment Viewer. It is also possible to execute new mapping using the same NGS data.
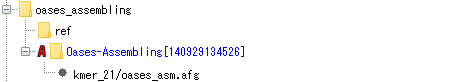
Assembly (using OASES):
Contains the AFG file of assembly result of NGS lead using OASES. Convert this to a BAM file and start the Alignment Viewer. It is also possible to use the same lead and execute a new assembly.
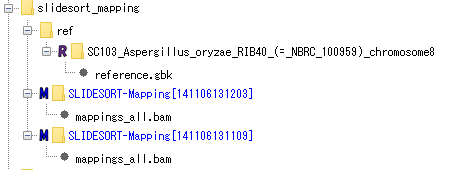
Mapping (using SLIDESORT):
contains reference genomic data and results mapped using SLIDESORT on its genome. You can browse and analyze the reference genome data by activating the IMC, convert the mapping result to a BAM file, and view and analyze it with the Alignment Viewer. It is also possible to execute new mapping using the same NGS data.
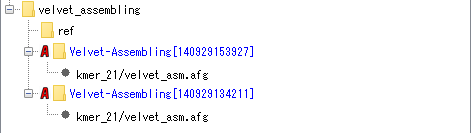
Assembly (using Velvet):
The AFG file of assembly result of NGS lead is stored using Velvet assembler. Convert it to BAM file and start up Alignment Viewer. It is also possible to use the same lead and execute a new assembly.
Work Bench 10
 |
|
Work Bench Structure 3
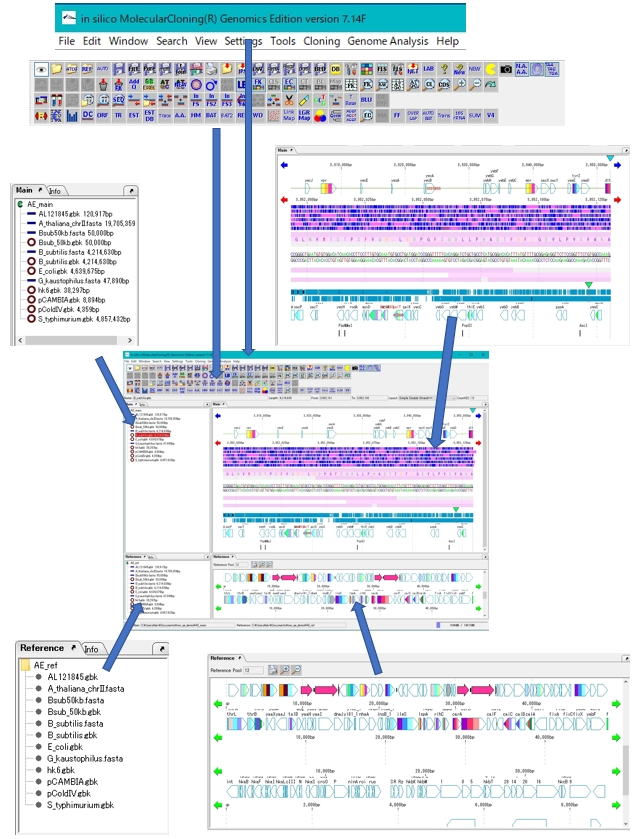 |
IMC's workbench consists of the following elements.
Elements marked with * can be docked out (removed) and docked in (incorporated) from the workbench window. |
Directory Tree 2
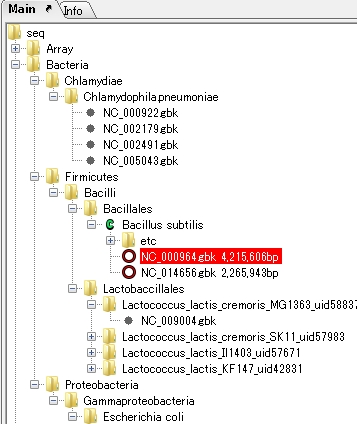 |
|
Menubar 2
The menu bar launches each function of the IMC.
Many functions have both a menu bar menu and a toolbox icon, both of which operate equally.
There are things with menus other than the menu bar.
There are menus on the lane or on the feature lane feature, and perform limited functions on preselected ranges.
Toolbox 3
The main tool box launches each function of the IMC.
Many functions have both a menu bar menu and a toolbox icon, both of which operate equally.
The main toolbox is usually docked in at the top of the main window, but you can dock out of the window or minimize the display as needed.
Individual main tool icons can be hidden independently.
Various windows and dialogs other than the main window also have their own tool boxes.
However, these visibility can not be changed.

Feature Key and Feature 24
Management and Operations of Feature Keys 2
Default feature key
Create, edit, delete feature keys
Template function
Feature key search
Attributes of Feature Key 0
Feature Keys
Attributes of Feature Keys
IMC Original Set Feature Keys 1
IMC has its original feature key set.
These Original feature keys exist to control the drawing and editing of features.
There is also a function to remove all original feature keys at once.
Types and Roles of Qualifier 0
Types and Roles of Qualifiers are explained here.
View and Edit Qualifier 4
It collects information on the display method and editing method of Qualifier showing the attribute of Feature.
The following shows two ways of displaying the value of Qualfier described in Feature.
Feature Position on Genome Sequence 1
Explanation on the location of the feature on the genome sequence.
Feature Fragmentation 0
Fragmentation of features by restriction enzymes and PCR amplification.
Feature Synthesis 0
Explain synthesis of features by PCR or ligation.
Feature Fusion 1
Feature Fusion is a feature that merges features belonging to the same Feature Key in two identical positions into one. Qualifiers recorded in each feature to be merged are kept equal on either side as the Qualifier of the merged feature.
This feature makes it easy to combine multiple annotations separately attached to the same feature into one.
Feature Operators 1
The Feature operators are logical arithmetic functions of performing logical operations on two mutually overlapping features belonging to the same Feature Key and generating new features.
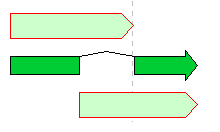
A feature where the upper and lower arrows in the above figure overlap, and the center divided arrow is a computed feature generated.
Link and Refer on Feature 1
You can link to individual features and activate the visualization tool as follows.
- Molecular structure files and its visualization tool,
- Document file (pdf) and PDF display tool
Feature Mapping 0
Mapping to Individual Features
Feature Export 3
You can select the base sequence or amino acid sequence of the feature and export it as a file.
The Feature Export function has the following.
- Export Feature (CSV) ... -> Export features and sequences in CSV format.
- Export Feature & Sequence (DDBJ) ... exports features and sequences in DDBJ format.
- Export Feature (BED) ... -> Export features in BED format.
Besides, using the function to output the result of the search function as a file actually becomes a feature export.
- Export from Feature Key Search result dialog
- Export from Keyword Search result dialog
- Export from Classification Search results dialog
Attach Sequential Number to Feature (Qualifier Editing) 3
Add a serial number to any Feature Qualifier.
You can select Qualifier to be serial number.
Normally, users can not register their original qualifiers, but you can create your own original qualifier that is used only when adding sequential numbers.
Sequential numbers consist of prefixes + sequence numbers, and consecutive numbers are further generated with a starting number and an increment.
The features that are subject to the sequential numbering are added in order from the one closest to the base position of the genome base position.
Not only features belonging to one type of feature key, but also features belonging to multiple feature keys can be mixed and added sequentially.
Sequential numbers can also be added for narrowed objects such as search results.
Sequential numbers can be added with the following search function.
- Statistics
- Keyword Search
- Feature Key Search
Feature Map 64
 |
Genome feature map creation / drawing function
|
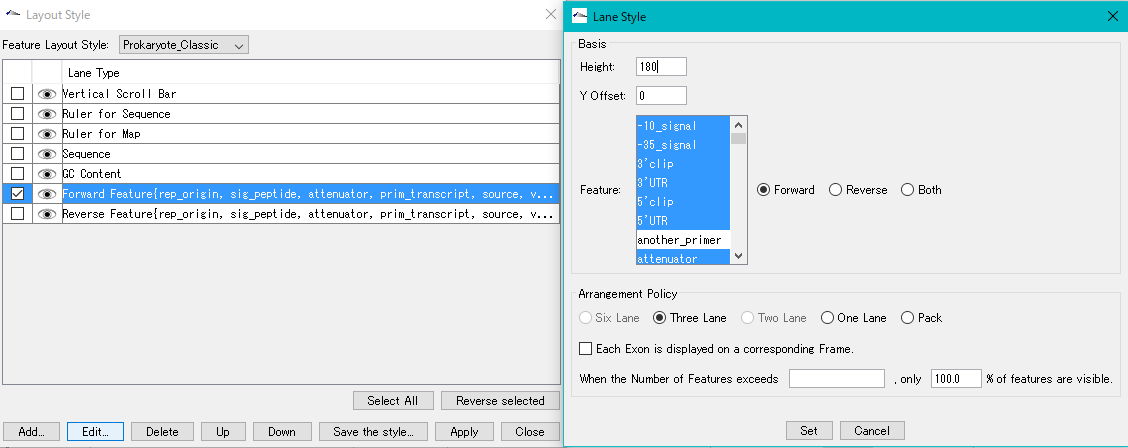
Feature Layout Style 23
By using the feature layout style, you can easily draw feature maps with complicated feature layouts by applying pre-registered layouts when drawing a feature map by combining multiple functional lanes.
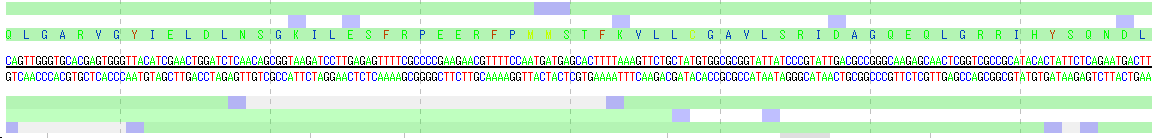
Sequence Lane 9
In the sequence lane, the base of the currently loaded genome sequence file and the amino acid sequence if it is the coding region are displayed for each strand.
A sequence lane can be placed anywhere in the feature map. You can place more than one sequence lane on one feature map if necessary.
Four bases and 20 amino acids can be displayed individually in different colors.
Changing the drawing color and font size is done in the Sequence Lane tab pane of feature setting dialog.
You can change which position of amino acid 1 character code is placed in codon.
You can not change the font type.
Feature Lane 12
- The above figure is a feature lane of the forward strand in three frame format.
- The following functions can be executed from the feature lane setting dialog.
- Display feature key (s), strand selection, arrangement method (Six Lane, Three Lane, Two Lane, One Lane, Pack), Chain change (Forward, Reverse, Both), Exon display method change, Placement density, Lane Height change, offset change.
Content Profile Lane 3
Content profile lane is a lane for displaying numerical values such as base composition, sliding window method and their profile.

The registered profiles that can be displayed in the content profile lane are as follows.
- GC Content
- GC Content
- AT Content
- A Content
- C Content
- G Content
- T Content
- GC Skew
- AT Skew
- Cumulative GC Skew
- Cumulative AT Skew
- Fickett
- Import Map Data
Navigation Lane 1
Navigation Lane displays the bird's-eye view map of the entire Feature Map, and you can move the display position of the Feature Map with the slider.
- The items that can be changed from the navigation lane setting dialog are as follows.
- Feature (s) can be selected. Strand selection (Forward, Reverse, Both), placement method selection (Six Lane, Three Lane, Two Lane, One Lane, Pack), thinning setting change.
Restriction Enzyme Lane 1
- The items that can be changed from the restriction enzyme lane setting dialog are as follows.
- Lane height, set switching, narrowing down of restriction enzyme list (recognition sequence length, palindromicity, terminal shape (Blunt, Sticky), DAM / DCM, number of cleavage sites of target sequence, selection of restriction enzyme.

Frame Lane 3
- Frame Lane is a lane displaying areas where stop codons do not appear consecutively for each of six frames.
- For each of six frames, the region from the stop codon to the stop codon indicates the region with the specified number of codons or more.
- You can register as a new feature by right-clicking an area where stop codon does not exist.
LGRMap Lane 0
The local genome rearrangement map lane (LGRM lane) is a lane for drawing the local genome rearrangement map on the main feature map.
Display mutations in base units between two closely related strains.
The mutation list dialog is linked to this lane.
Implementation Edition
IMCGE![]() , IMCPE
, IMCPE![]()
Expression Profile Lane 0
Expression profile lane is a lane for graphically displaying expression data by tiling array or RNA-Seq.
Implementation Edition
IMCGE![]() , IMCPE
, IMCPE![]()
Multiple expression profile lanes can be registered and displayed in the main feature map, and the number of lanes that can be registered and displayed on one feature map is not limited.
When the number of display lanes increases, it is necessary to scroll vertically.

The lane can display the expression level depending on the genome position as a bar graph or a line graph.
You can change display and calculation settings for each lane.

Other Lanes 0
Vertical Scroll Bar Lane

Sequence Scale Lane and Map Scale Lane

Data Handling 10
This is an operation explanation about the sequence data file, feature data file, optional data file, etc. used in IMC.
Load Sequence File 3
Load genomic sequence and amino acid sequence file into IMC.
Save Sequence File 5
Save genomic sequence and amino acid sequence as file.
Import and Data Mapping 1
Import data from the outside and map it on the sequence.
Extract from Sequence and Export 1
Extract data from the sequence and export it externally.
Data Conversion 0
Convert data from one format to another.
Application Data File Operation 0
Describe operations of restriction enzyme data file, primer data file, option data · file, etc.
Search 30
|
Search Common Operations 4
The operations common to various search functions are explained here.
Feature Key Search 0
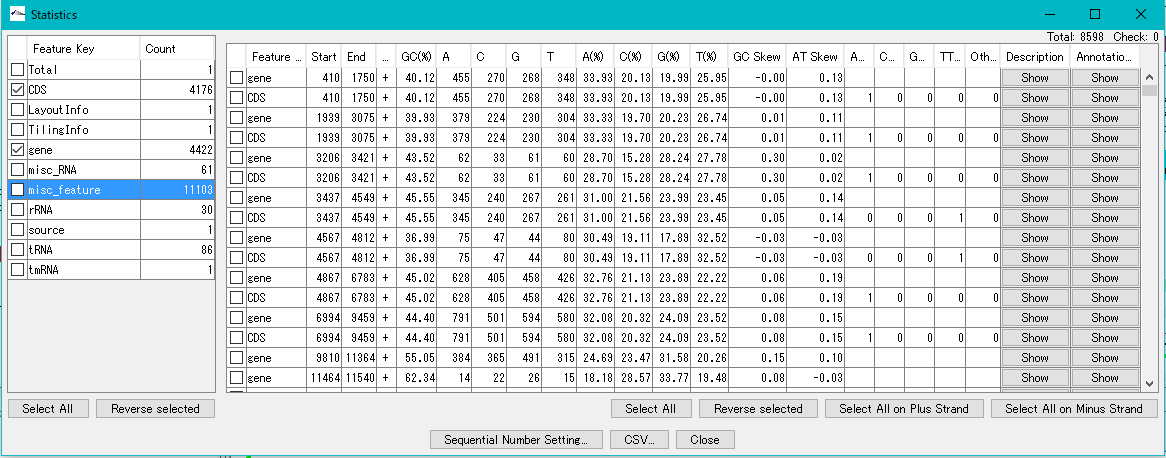
Counts the number of feature keys registered in the main current array and displays a list.
Several features to be searched can be selected, and the search range can be limited.
On the search result screen, buttons for feature key number, position on array, base length, gene name, base sequence, button to annotation to descriptions are listed.
In CDS, it is possible to perform operations such as selection of amino acid sequence, + chain strand only, collective deletion, codon table, serial number addition, Fusion PCR.
When you click a line, the main feature map shows the location of that feature.
File output in CSV / FastA / GenBank format is possible.
Keyword Search 2
- It is a function to search annotations by entering keywords.
- Multiple target feature keys can be selected.
- Multiple keywords can be specified and logical operations between keywords can be selected by AND / OR / NOT.
- Search scope can be limited to CDS area and Inter Genic area separately.
- On the search results screen, buttons for feature key number, position on sequence, base length, gene name, base sequence, button to annotation to descriptions are listed, CDS shows weekly amino acid sequence, + chain
- You can perform operations such as display selection only for chains, delete all at once, display codon table, search and add sequence number to features, transfer list to FusionPCR function.
- When you click on the row in the results list, the main feature map will display a map of that feature - position.
- You can output files in CSV / FastA / GenBank format.
- Qualifier batch deletion is also implemented.
Pattern Search 6
- Select multiple registered array patterns and detect patterns existing in the current array.
- It is also possible to search by entering new patterns when searching.
- The search range can be specified and the search target strand can also be specified.
- Mismatch detection of 1 to 2 letters is possible.
- You can also specify the search region of the CDS region or intergenic region.
- It is possible to search only upstream / downstream designated areas of CDS.
- In addition, multiple arrays can be set as search targets.
- On the search results screen, you can display the detected number, the position on the sequence, and the genes upstream and downstream for each pattern.
- In addition, results can be automatically registered as new features.
- The result can be output as file in CSV / FastA format.
- When you click on a row in the search result list, the main feature map moves so that the position of the pattern is at the center of the map, and the corresponding pattern array on the array lane is highlighted.
Homology Search 18
By simply loading the genomic base sequence into the reference genome map, a database for Blast search is automatically created and homology search (Blast) search for that database can be easily performed.
For homology search, it is necessary to specify the query sequence and sequence database and search program.
There are the following methods to specify query sequenses.
- Enter the query sequence directly
- Paste query sequence
- Refer to the query sequence file saved as a file
- Right click on one feature on the main feature lane and make the sequence of that feature - the query array
- Right click on one feature on the reference feature map and make the sequence of that feature - the query array
- Sequence of all the features in the selection area of main feature lane (selectable by mouse drag) as query sequence (multiple queries): implemented GE AE DS GT
The database for search has the following.
- Genomic base sequence (including amino acid sequence on CDS) loaded in current reference feature map
- Registered genome base database or amino acid sequence database
- NCBI base sequence database or amino acid sequence database
You can select the search program from the following.
- BlastN
- BlastP
- BlastX
- tBlastN
- tBlastX
Homology Search on the Current Genome by Entered Sequence 0
A homology search is performed using the entered sequence on the genome sequence displayed on the main feature map.
Batch Homology Search 2
Homology search is performed in bacth and mass with all the features present in the designated genomic region as query sequences.
Priming Site Search 0
Please refer to restriction enzyme treatment.
SNP Search 0
Please refer to mutation search function.
Gene Function Code Search 0
- We select multiple genetic function codes (code is optional but COG classification is common) and search for CDS features with those functions.
- Search range can be specified, and multiple arrays can be searched.
- From the search result screen, the CDS number, the position on the sequence, the strand, the explanation of the COG, the locus_tag, the upstream downstream gene, the CDS base sequence, the description window and the link to the annotation window are displayed from the search result screen .
- An amino acid sequence can be output separately.
- Batch delete of hit CDS, Fusion PCR, codon usage frequency table display is possible.
- When you click on the row of the result list, the main feature map shows its position.
- List output in CSV / FastA / GenBank format is also possible.
- There is also the option to display only the searched features on the current map.
View 36
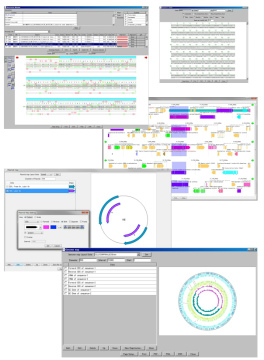 |
IMC has various display windows as follows.
|
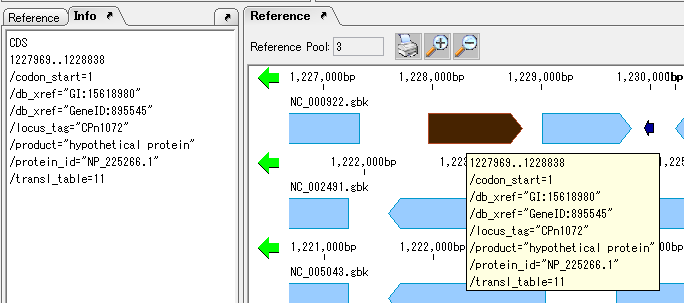
GenBank EMBL Viewer 1
- A viewer that can view the currently loaded sequence file in its original format.
- When you click on an sequence or annotation, the main feature map will display a map of that position.
- Conversely, with this viewer open, you can click on a part of the main feature map to display the text at the corresponding position in the file.
Sequence Viewer 2
- A viewer that displays a sequence of the area currently displayed in the main feature map.
- You can display the display range on the viewer, show / hide the reverse strand, display / not display the amino acid translation, change the display method of the scale, display number of bases displayed.
- You can output image files in PDF, PNG, EMF format respectively.
Annotation Viewer / Editor 12
It is a viewer / editor prepared for genome annotation.
It is a window independent from the main window.
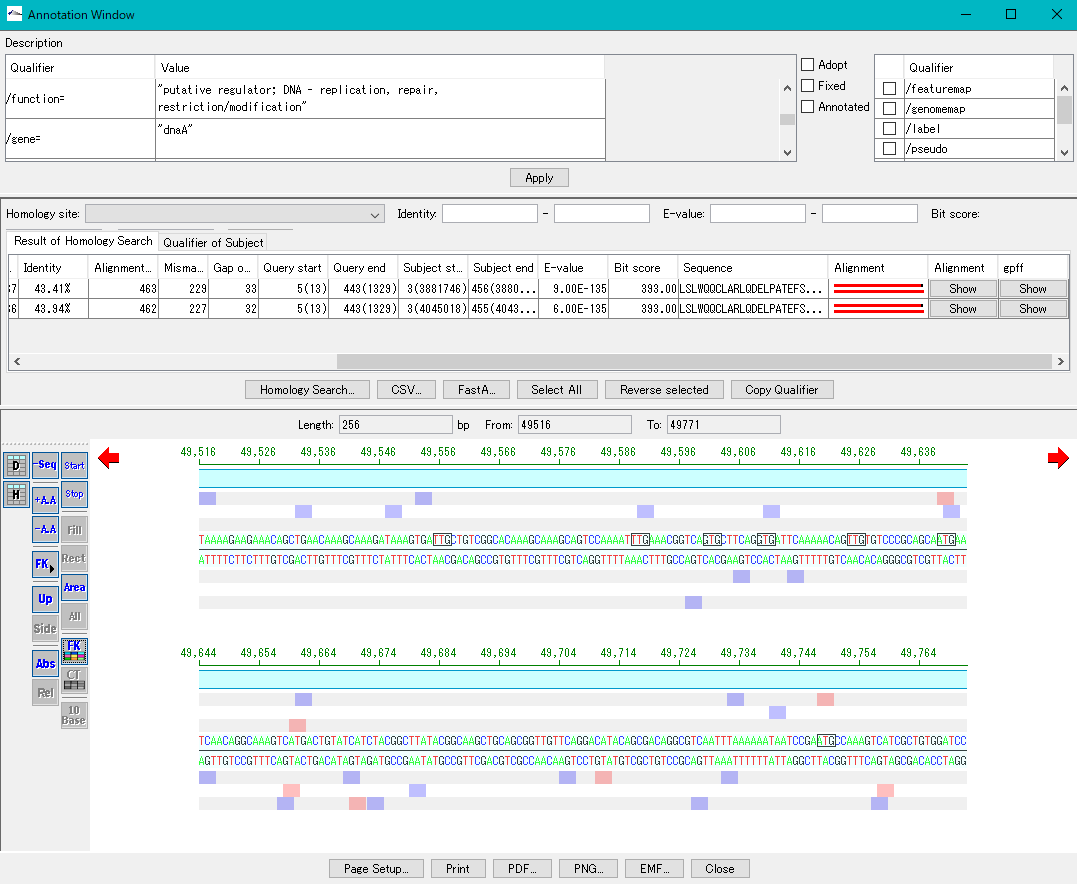
Viewer function
- Mainly used for annotating CDS.
- The window is divided into three parts, you can enter annotations directly, you can directly edit them, you can link the results of the homology search to the CDS features themselves and display them and post them.
- At the same time existing features can be selectively displayed in the array display area.
You can change the display settings for arrays, features, and tick marks. - Image contents can be output in PDF, PNG, EMF format.
- From this window you can also perform a homology search that queries this feature and the results are linked immediately.
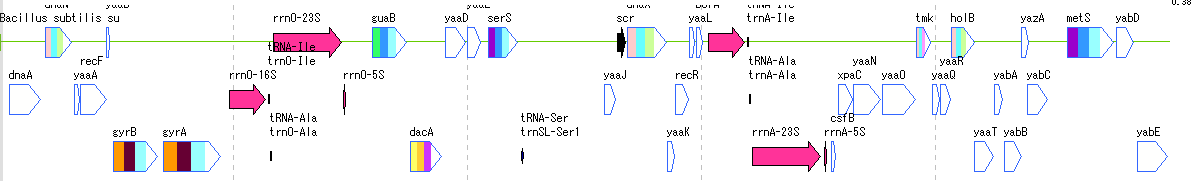
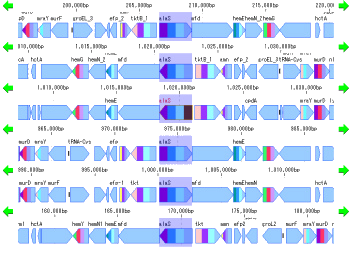
Multiple Linear Genome Map Viewer 2
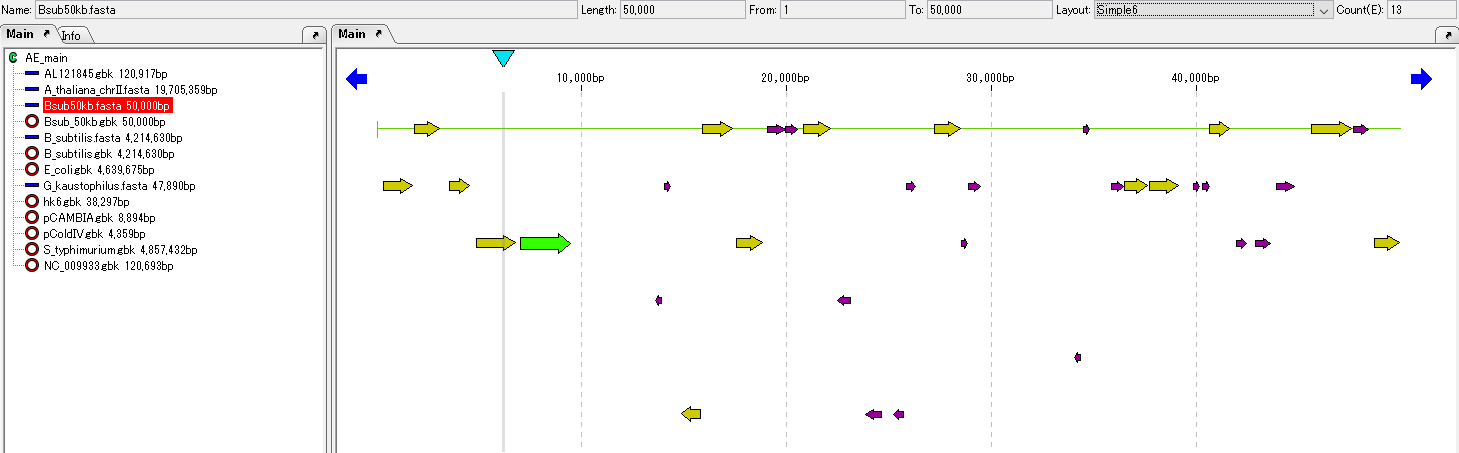
Multiple Linear Genome Map Viewer is a viewer that compares annotation such as genes of multiple closely related species genomes in parallel for each genome in parallel and is docked in the IMC main window.
We call aliases as linear genome map viewer, reference genome map, reference map etc.
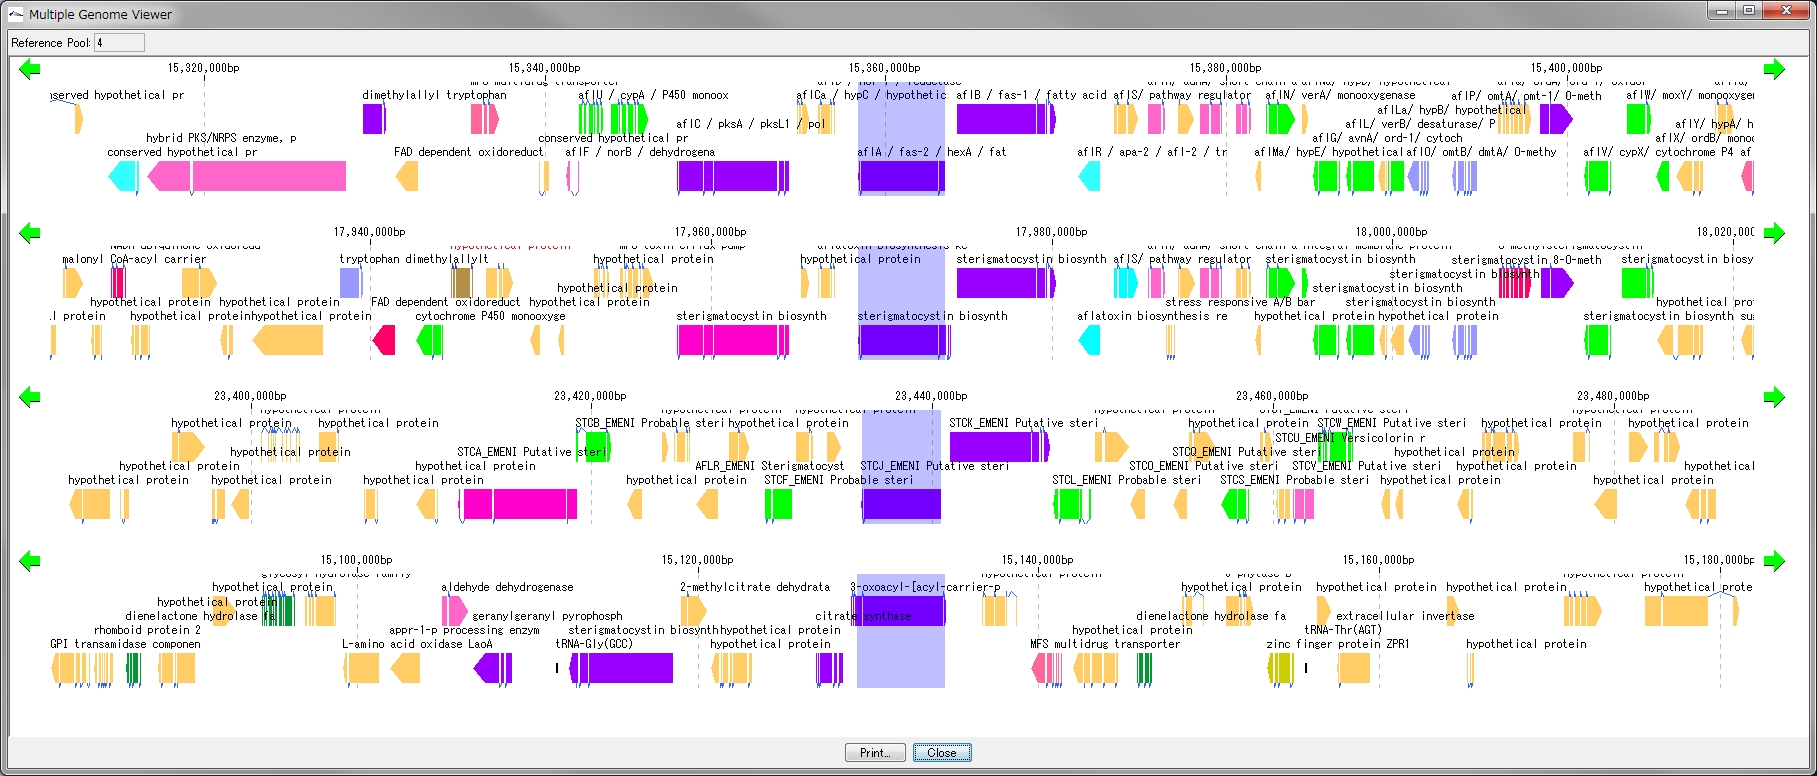
Viewer function
- You can dock out from the IMC main window and move and resize as an independent window.
- It can be linked with the main feature map.
- Homology searches can be performed on CDSs of other closely related genomes loaded from each CDS feature on a multiple linear genomic map.
- Gene cluster alignment can be performed to visualize the state of syntenic preservation near the ortholog gene.
- Change the genome display order using the corresponding reference directory.
- Map can be output as print or image file
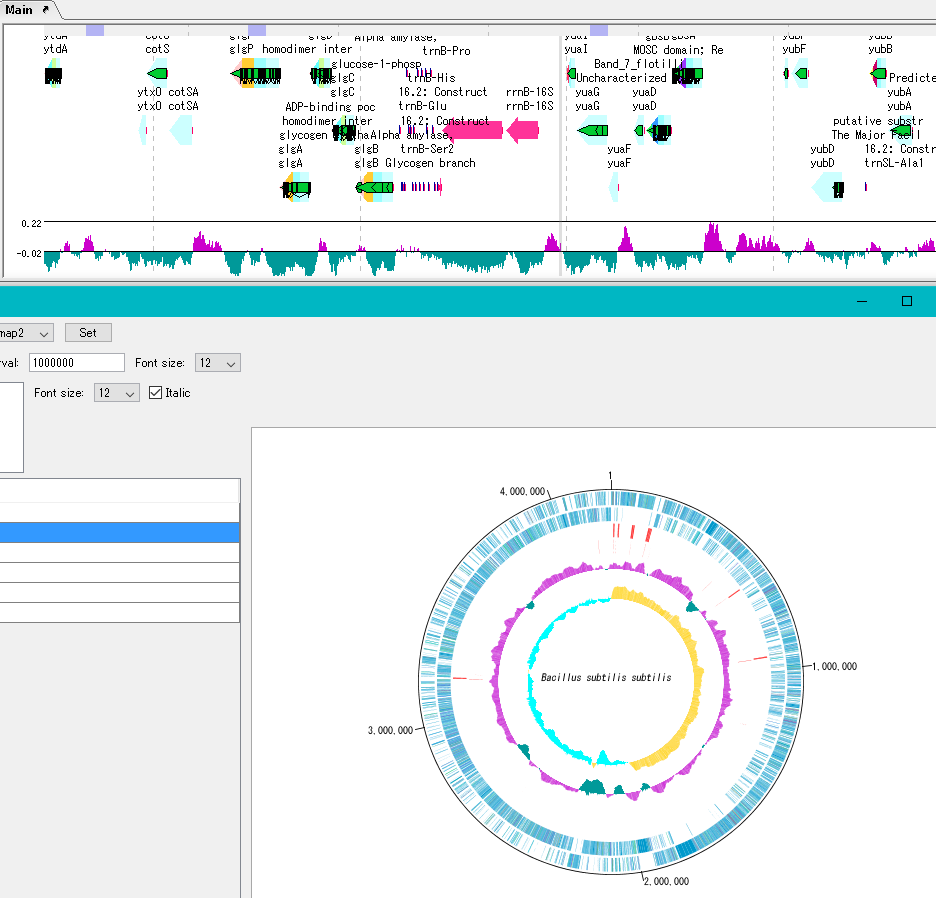
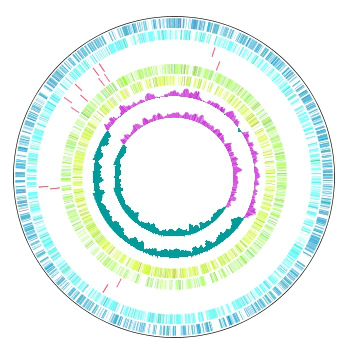
Circular Genome Viewer-Designer 9
Circular Genome Map (Circular Genome Map) is a function to compare and draw Features and Contents from arbitrary genomic chromosomes or genomic chromosomes of closely related species and arbitrary numerical data specific to genome position on concentric circles.
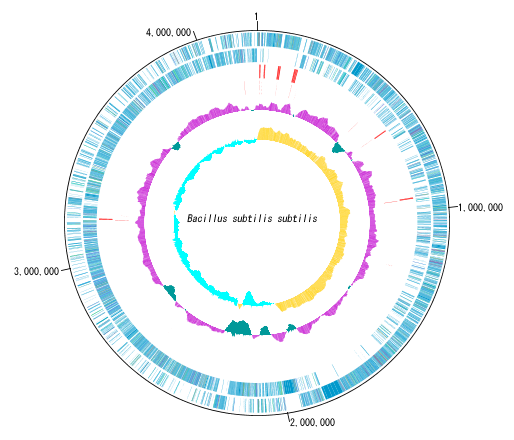
You can display distribution status of each gene such as genes of each genomic chromosome, change of base composition, etc.
The order of concentric circles of features and content profiles to be placed can be changed arbitrarily.
Drawing parameter setting can be changed for each concentric circle.
It is also possible to change the diameter of the circular genome map and the printing parameters.
For printing a circular genome map, in addition to direct printing, you can output files in PDF, PNG, and EMF formats.
A large number of features drawn on the concentric circle of the circular genome map can be classified and displayed in different colors depending on the annotation type if there are annotations.
- Circular Feature Lane Different Feature drawing independent color setting is possible.
- Feature Key Draw with different colors.
- When Color Qualifier is set, draw the CDS Feature with the specified color.
- Draw the CDS Feature with the color specified in the Classification code.
- Draw the CDS Feature with color derived from EC Nubmer.
- Draw the CDS Feature with the color specified in the Category code.
- Draw the CDS Feature with the color specified in Blast's score range.
Sequence files drawn on the circular genome map are referenced in the order shown in the main current directory. For this reason it is easy to manipulate drawing a number of different circular genome sequences in the same format.
By clicking on a part of the circular genome map it is possible to display the area of the corresponding main feature map.
In the circular genome map, the sequence file name and total base length (when single genomic chromosome) are drawn at the center, and the base number scale is displayed around it.
The starting position base of the scale can also be changed.
The map layout can be registered as a layout style, and the registered circular genome layout style can be called later.
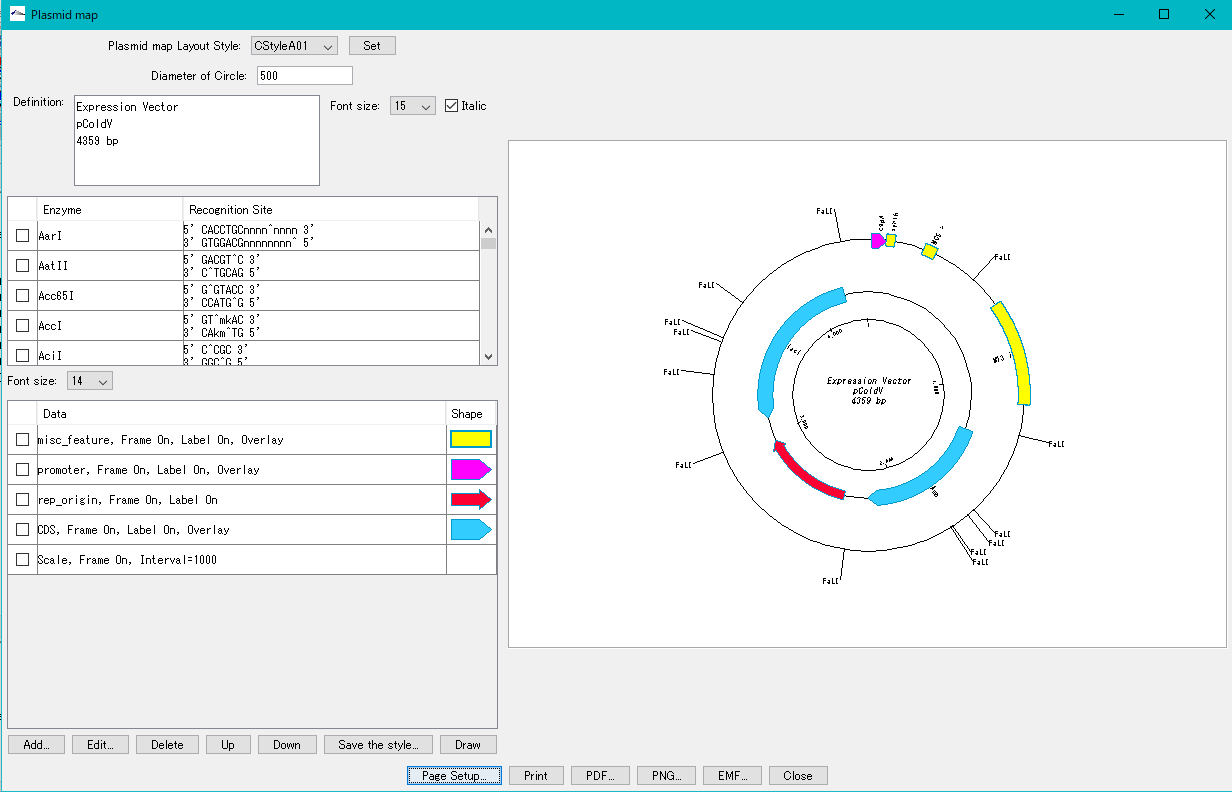
Plasmid Map Viewer - Designer 3
- It is similar to the circular genome map editor, but draws a relatively small circular genome.
- The annular lanes are arranged concentrically, and you can place multiple feature keys on one concentric circle.
- Strand, frame, feature shape, color designation of fill and frame, thickness of frame, selection of color classification, display / non-display of label, selection of Qualifier to be used as a label, font size, two concentric circle overlay functions ,
- You can change the scale interval.
- Designed styles can be saved and applied to other plasmids.
- You can change the order of concentric circles, add / delete, and edit.
- Plasmid maps can be output in three types of image formats: PDF, PNG, and EMF.
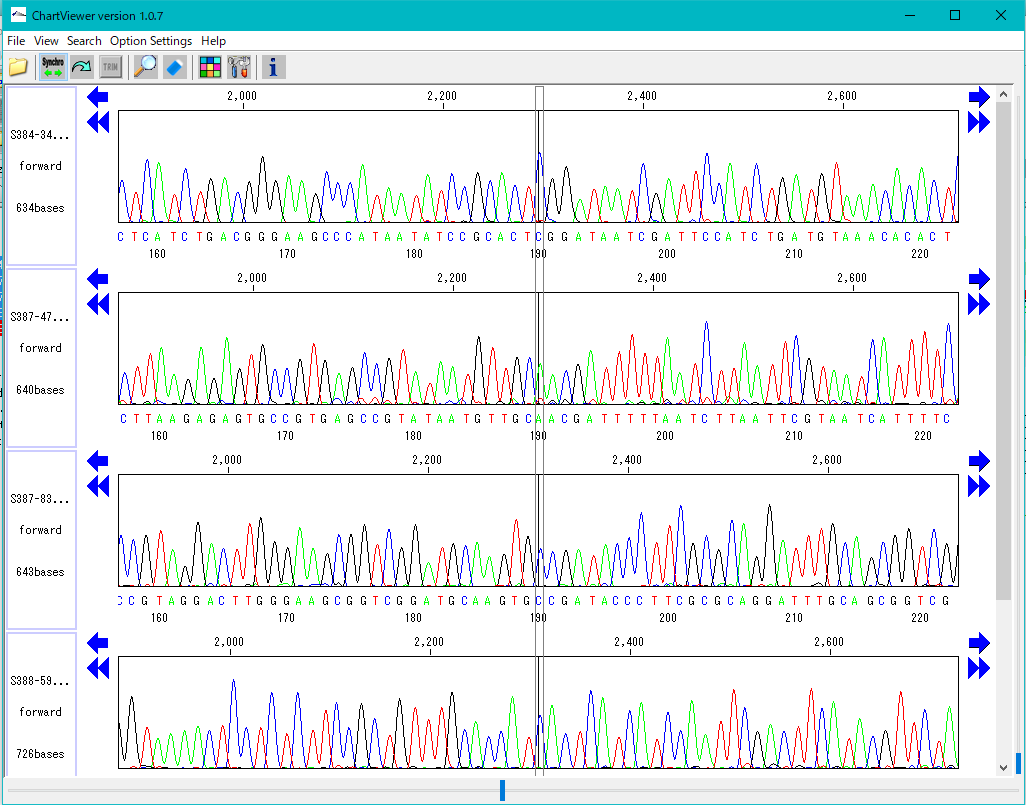
Trace Viewer - Editor 1
It is a viewer / editor which is used when reading output file from ABI, SCF capillary sequencer.
Displays not only the base sequence but also the trace waveform.
Function
- Multiple files can be displayed in parallel.
- It corresponds to ABI, SCF format file.
- It is displayed on a separate window separate from the main feature map.
- The trace waveform viewer window can be resized.
- You can change by dragging the display position of each waveform.
- You can change the height of the trace waveform display frame.
- You can change the display color by base.
- Each waveform can be scrolled horizontally independently.
- If the position of each trace waveform is aligned, you can scroll interlocking sideways.
- You can freely change the width and height of the trace waveform with the slider.
- You can search for restriction enzyme recognition sites and highlight sequences after searching.
- You can also start from Trace Mapping execution result.
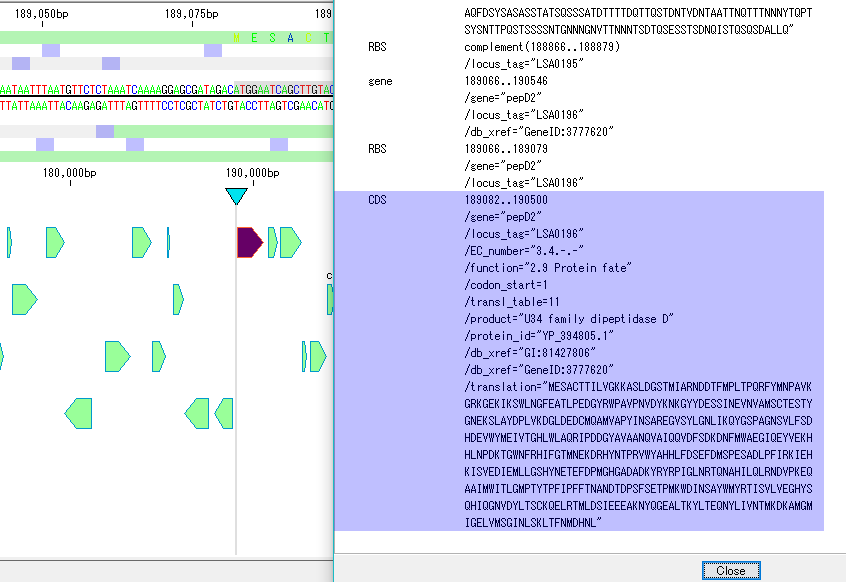
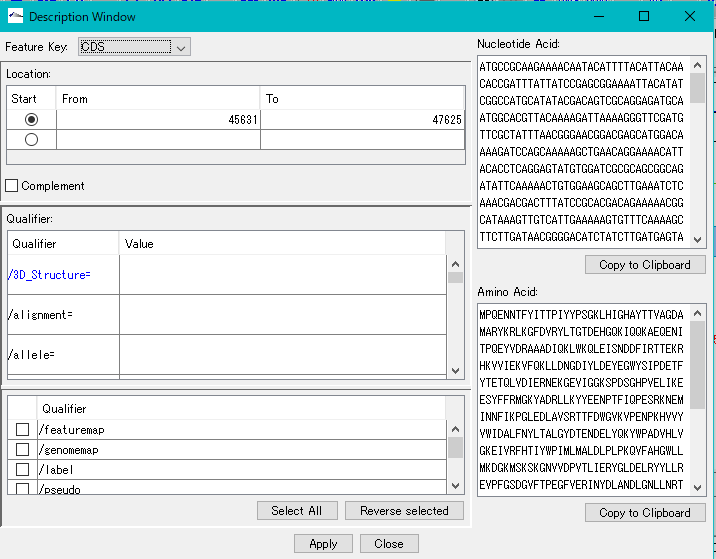
Description Window 2
The description window is a window for entering and editing values in the feature's Qualifier.
Launched with a right click on the feature and you can edit all the Qualifiers for that feature.
Change the Position of the feature.
Change the Feature Key to which the feature belongs.
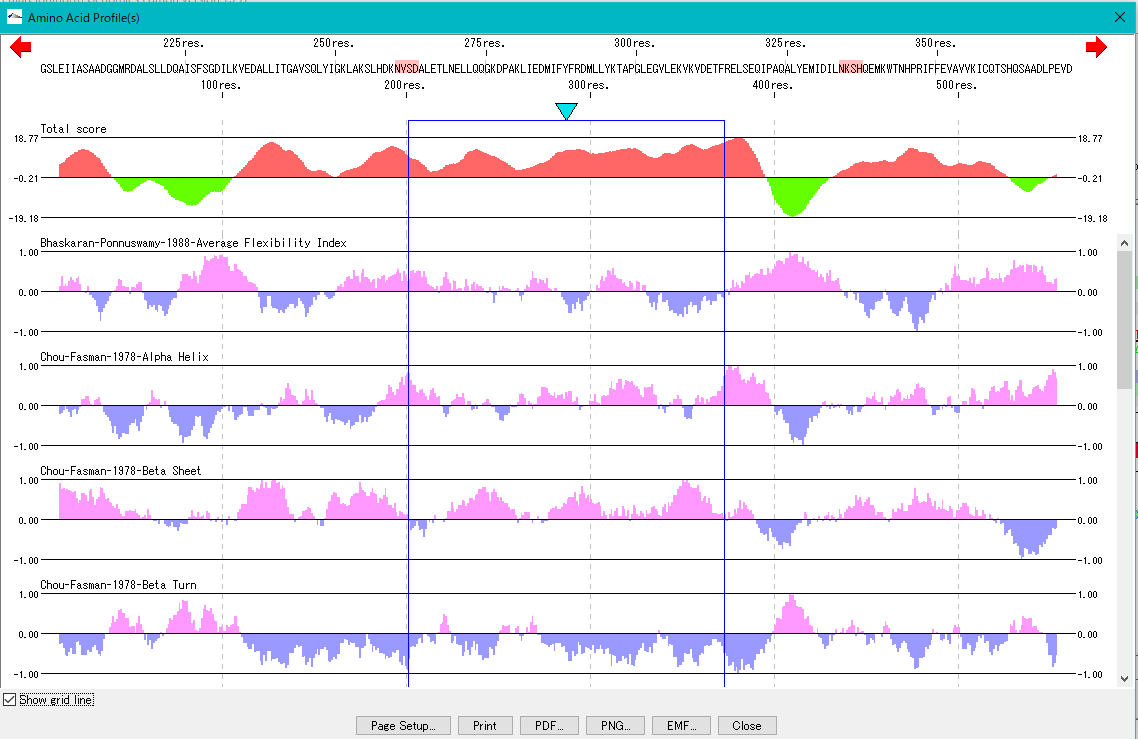
Amino Acid Sequence Profile Viewer 2
This is a viewer that displays profiles such as secondary structure of amino acid sequence in parallel. Total profile design and display, motif display and so on are possible.

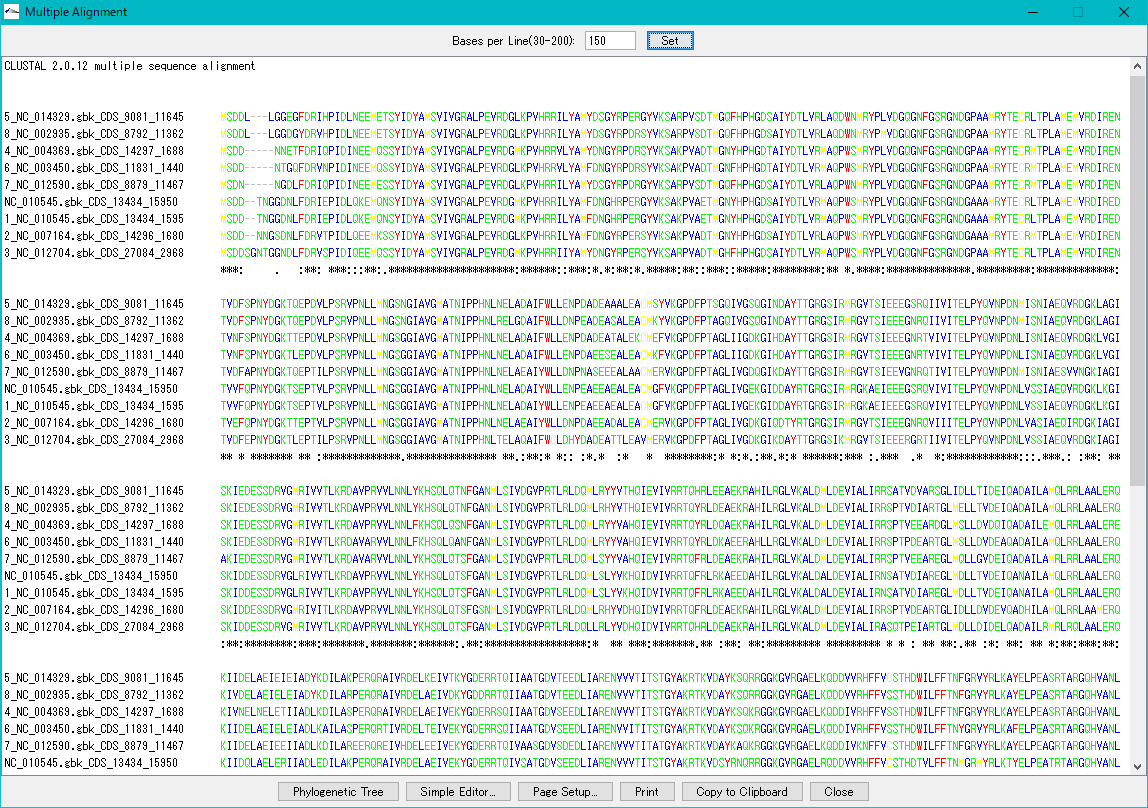
Multiple Alignment Viewer 1
Multiple alignment viewer is a window for displaying multiple alignment of DNA sequences and amino acid sequences.
Multiple alignment viewer can be launched from homology search result dialog etc.
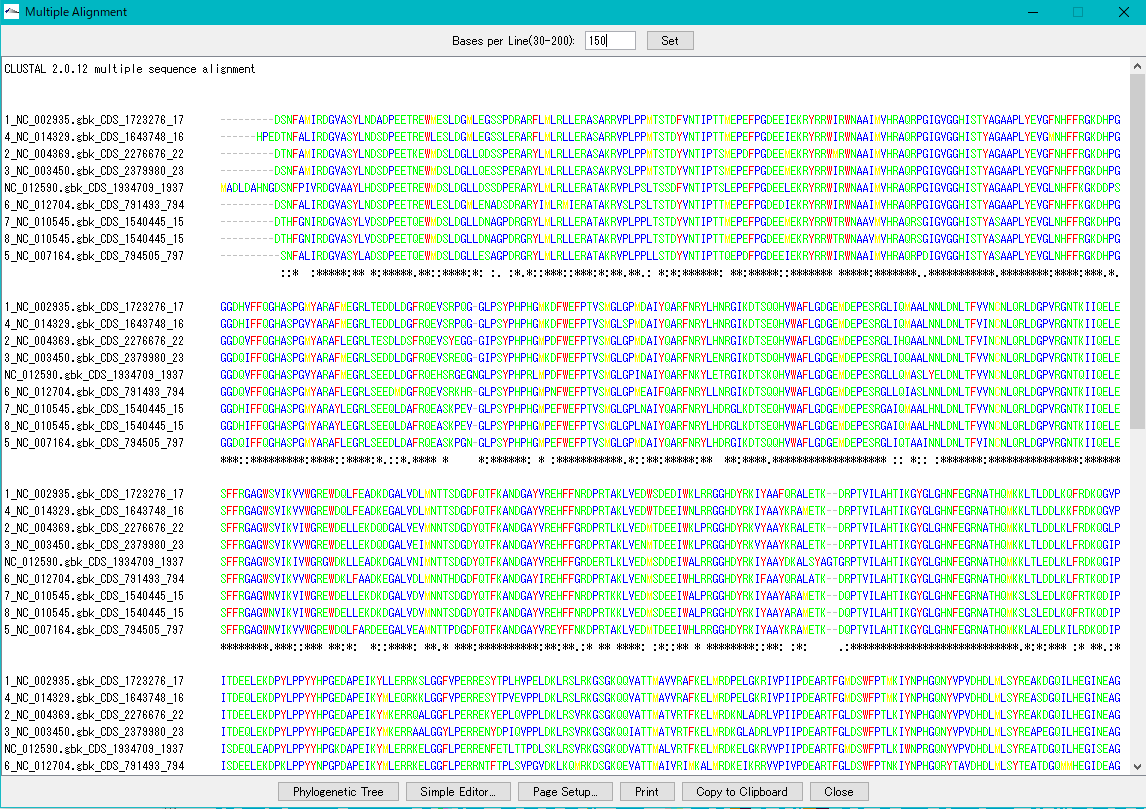
Viewer function
- Launch Phylogenetic Tree drawing dialog to draw molecular phylogenetic trees.
- Launch the simple editor of multiple alignment.
- Print the alignment chart. You can copy the alignment to the clipboard and use it with another software.
- Change the number of displayed bases and the number of residues on one line.
- Change the display color of bases and amino acids.
- For multiple alignment generation, CLUSTALW is used.
Phylogenetic Tree Viewer 1
Molecular phylogenetic tree viewer is a tool to draw molecular phylogenetic trees from sequences of such as genes.
This viewer can be launched from multiple alignment viewer.
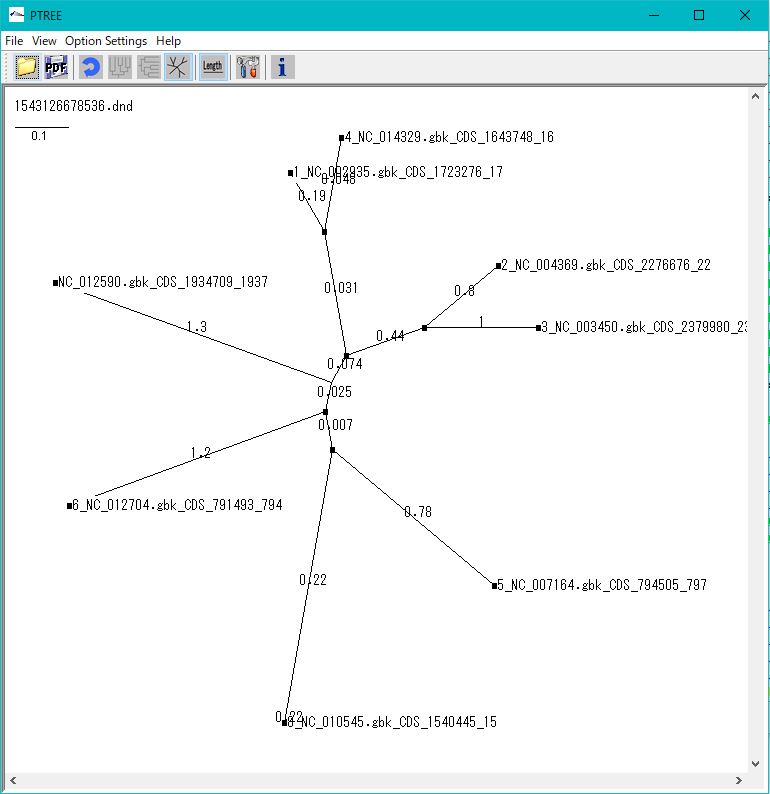
Viewer Function
- Draw rootless tree and rooted tree.
- DND format file can be loaded and rendered.
- Evolution distance can be displayed.
- Print and output image files.
GT Alignment Viewer 0
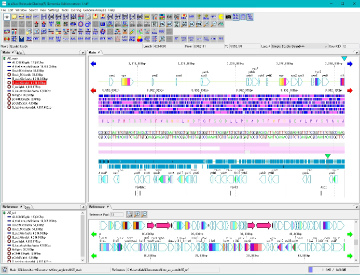
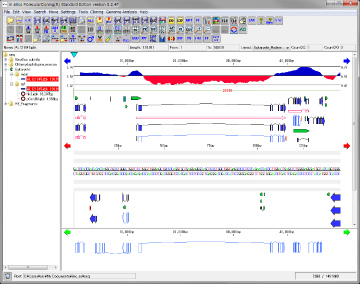
Alignment Viewer is a viewer editor that displays the primary analysis result of GT and executes secondary analysis etc.
Alignment Viewer can be launched from GT's main window.
The Alignment Viewer consists of a menu bar, a tool box, and four panes.
Although the menu bar is fixed in the Viewer window, the toolbox and the four panes can be removed from the window and displayed at any position on the desktop.
The toolbox can also be hidden.
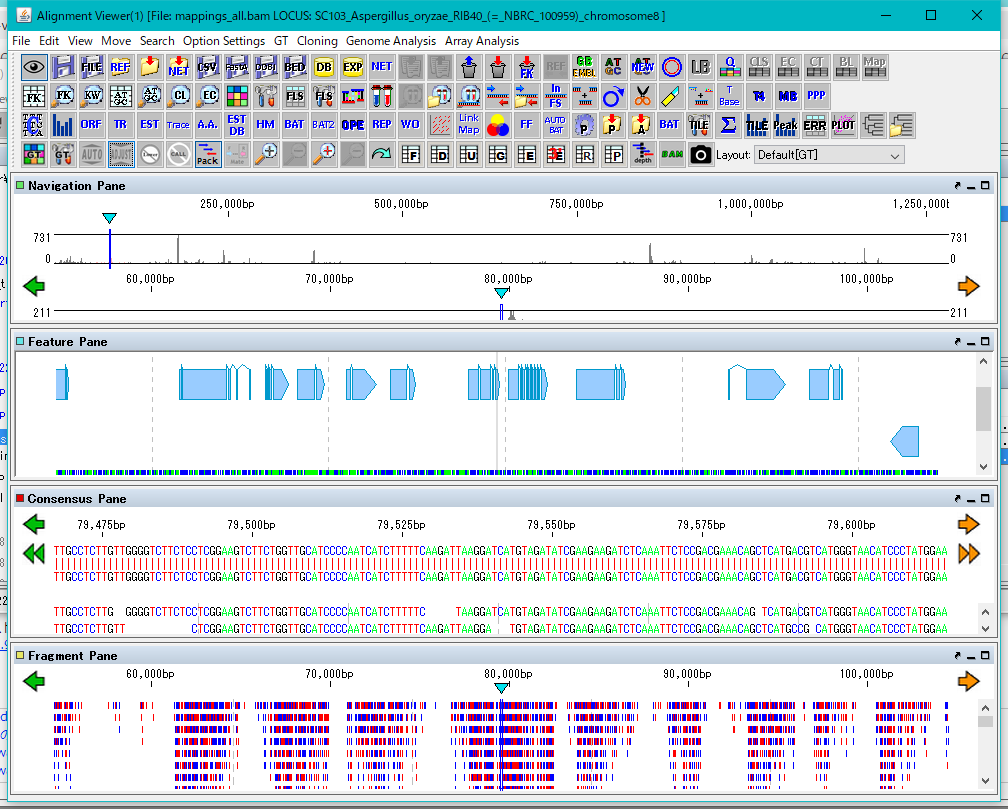
The four panes are named as Navigation Pane, Feature Pane, Consensus Pane and Fragment Pane from the top.
Navigation Pane is a special pane for navigating the other three panes and has a two-step scale of genome-wide scale and scale within the selected region.
Feature Pane has functions similar to IMC's main feature map and can perform most functions of IMC.
Consensus Pane is a function to display the Assembly result as a sequence alignment of Contig and Read constituting it, and a function to display the Mapping result as a sequence alignment of the reference genome sequence and Read.
Fragment Pane is a function to graphically display Consensus Pane, which allows you to view assemblies and mapping in a more bird's-eye view.
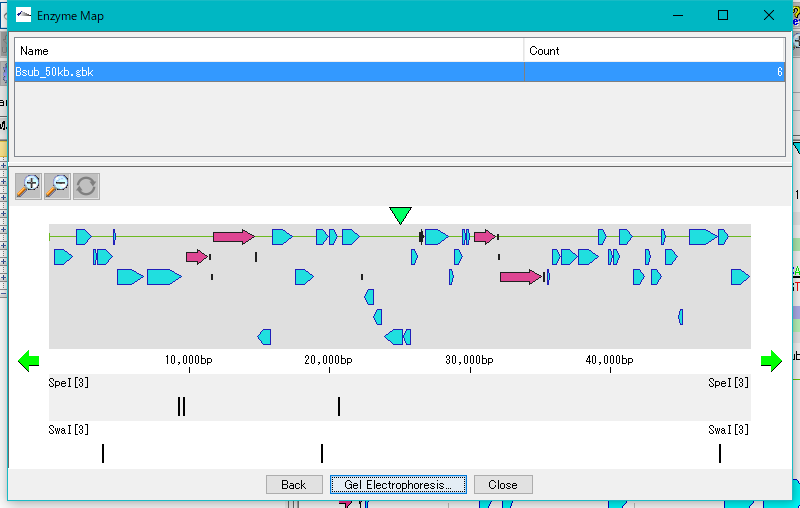
Restriction Enzyme Map Window 0
This is a window for drawing a restriction enzyme map.
It also draws a feature map similar to the main feature map.
Zoom, horizontal scroll, and gel electrophoresis diagrams are available.
Cloning 36
IMC is characterized by being able to perform operations of cloning experiment on computer. In this case, special data is unnecessary and it is possible to clone DNA sequence data which can be obtained from a public database such as GenBank or EMBL as it is. For cloning, restriction enzyme digestion, PCR primer design, PCR amplification, and ligation can be performed without changing the annotated sequence. All resulting cloning products are output in GenBank / EMBL format. Since Primer information is pasted and stored on the DNA sequence, it is also useful for Primer management.
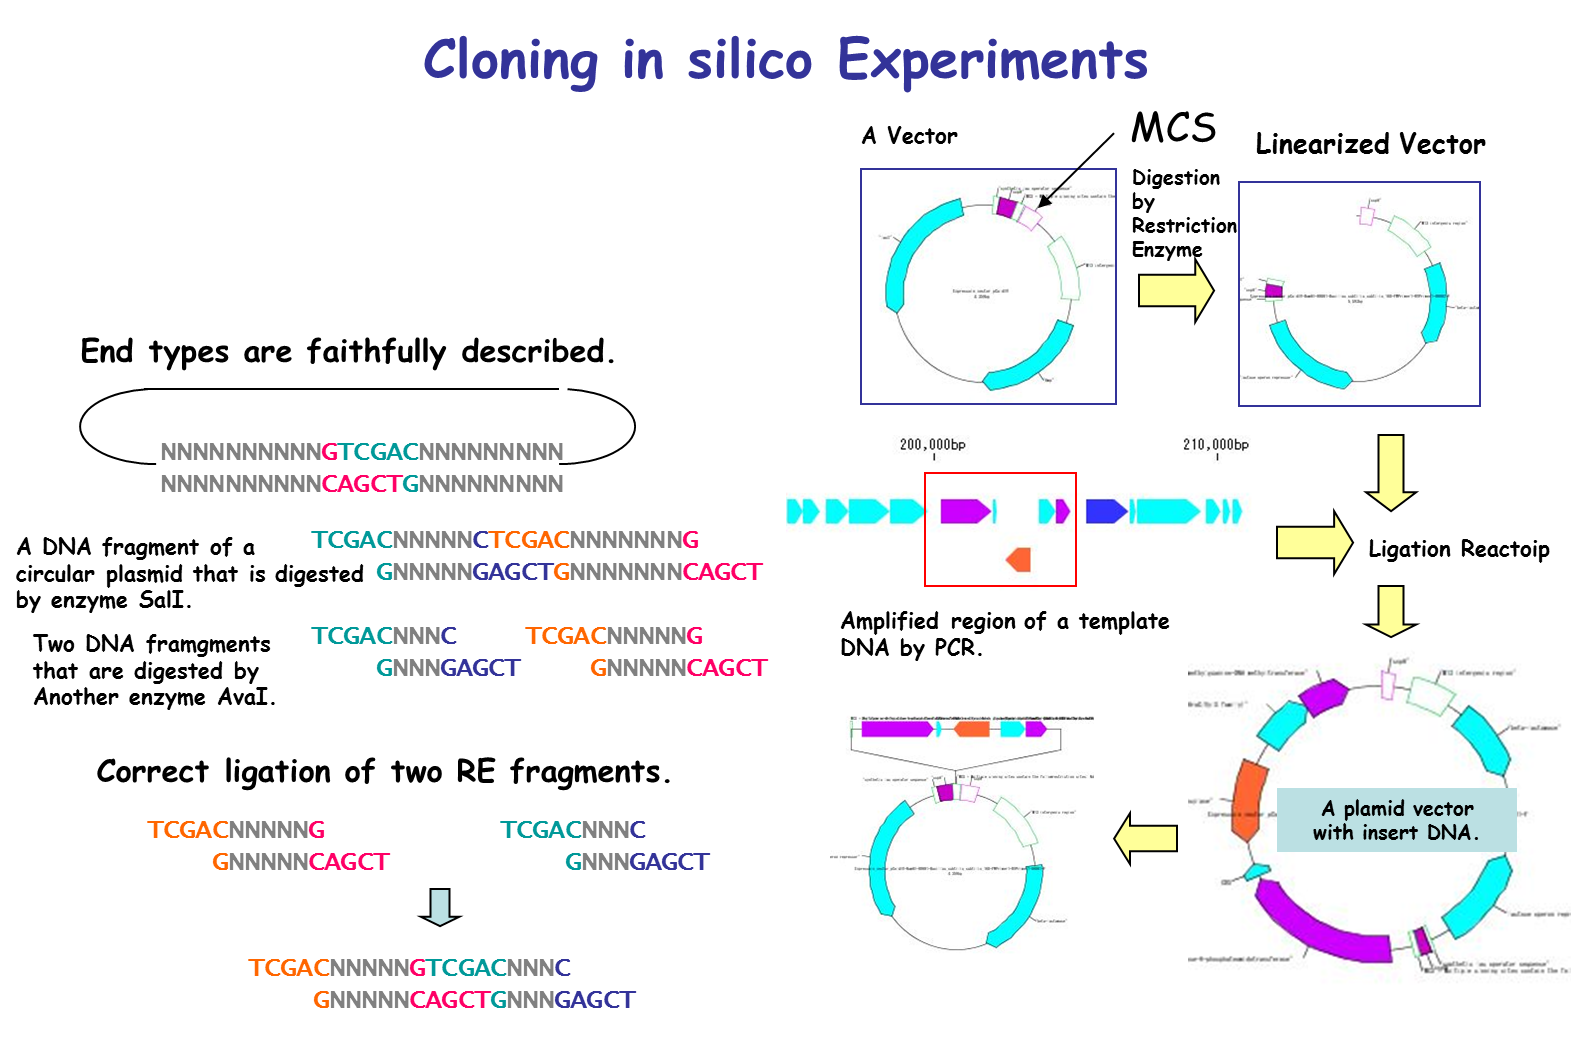
It is a cloning function that can actually cut / ligate.
in silico cloning experiment is possible.
It will help you to understand invisible molecular biology experiments. It can be used for assisting and simulating molecular biology experiments.
You can construct arbitrary Vector / Plasmid.
We will list optimal restriction enzymes for Vector insert check and simulate the gel electrophoresis results.
- Restriction enzyme treatment (restriction enzyme map, restriction enzyme digestion fragment generation, optimal restriction enzyme candidate list for insert check, others)
- PCR primer design,
- Primer design to avoid specific features,
- PCR replication (including annotation),
- Batch primer design to amplify all genes,
- Primer management ligation, self-ligation,
- Checking compatibility of base fragment end shape
- Plasmid map creation (Insert area blowing function) (Layout style correspondence)
- Addition of restriction enzyme recognition site to cloning DNA terminus with annotation described
- DNA terminal blunting, phosphorylation (dephosphorylation
- Arbitrary region extraction of annotated base sequence
Cloning in silico 1
Using IMC's in silico cloning function, continuous cloning experiment on PC or Mac is possible.
Digestion of the genomic DNA sequence with restriction enzyme, gel electrophoresis of the fragment, ligation to the opened vector, etc. can be carried out in succession.
Restriction Enzyme 12
With the restriction enzyme function of IMC, if annotation (Feature) is added to the original DNA base sequence, it can be fragmented with the annotation kept.
If one feature is divided by a restriction enzyme, its feature itself is inherited, but in some circumstances the feature key may be changed automatically.
The terminal shape of restriction enzyme digested fragments is preserved correctly. By doing this, we check whether ligation is possible when ligation between pieces is done.
In E. coli, it can be checked whether the methylation site affects restriction enzyme digestion.
It is also possible to register frequently used restriction enzymes as a set.
It is also possible to register newly provided restriction enzymes or delete restriction enzymes that are no longer used.
Restriction enzyme management
- Partial set selection,
- Filtering by type
- Distinction of the number of recognized bases
- Palindromic
- Distinction between smooth and protruding ends
- Presence / absence of DAM / DCM
- Difference depending on the number of cutting points
- Alias names of restriction enzymes list can be saved, list editing is possible.
- You can also register enzymes, edit enzymes, delete enzymes.
Search function of restriction enzyme recognition site
- Search area selection,
- Recognition site search,
- Recognition site list display,
- Restriction map display,
- Collective search from multiple sequences
Primer Design 15
IMC has various PCR Primer design methods.
The ability to simply drag the nucleotide sequence on the sequence lane and register it as a primer
- Register primers from the sequence lane
- Register primers from the feature lane
Ability to design features on the feature lane and primers to amplify inside and outside the selected area
- Primer design for amplifying included products, including selected features of feature lanes
- Primer design for amplifying the product containing or containing the selected genomic region of the feature lane
A function of designing primers that amplify a large number of areas at once (with Iterate Design function: it is a function to repeat the design until there is no area that can not be designed)
- Batch PCR Primer Design Batch PCR primer design to amplify all features with specified feature key on genome
- Whole Genome Covering PCR Primer Design PCR primer design that PCR product completely overlaps whole genome or large genomic region with PCR product overlapping
- Sequencing Primer Design: Sequence primer design for sequencing DNA fragments that can not be covered with one lead of a capillary sequencer
reference
The following is a function to design a group of primers for cloning multiple DNA fragments at once, such as gene cluster design. From design to cloning, you can load cloned products into the IMC.
- In-Fusion Design Ver.1: Primer design function for In-Fusion Cloning
- In-Fusion Design & Build Ver.2: Primer design function for In-Fusion Cloning
- In-Fusion Design & Build Ver. 3: Ability to design and build gene clusters by dropping DNA fragments to be inserted into vector sequences
- Batch Gene Cluster Design & Build: the ability to design and build lumped numerous gene clusters by replacing the gene sets that make up the cluster
- Combinatorial Design & Build: The ability to combinatorially combine design and build a fragment constituting a gene cluster
PCR Reaction 3
In the PCR function of IMC, the priming site of the registered primer set is searched from the genome base sequence. If both primers have a priming site on the genome, PCR amplify the region sandwiched between the primers.
In this case, adenine can be made to protrude by 1 base. It is used for TA cloning.
An annotation is inherited also in the amplified PCR product when the template DNA sequence is annotated (Feature).
It is also possible to perform PCR on multiple template DNA sequences.
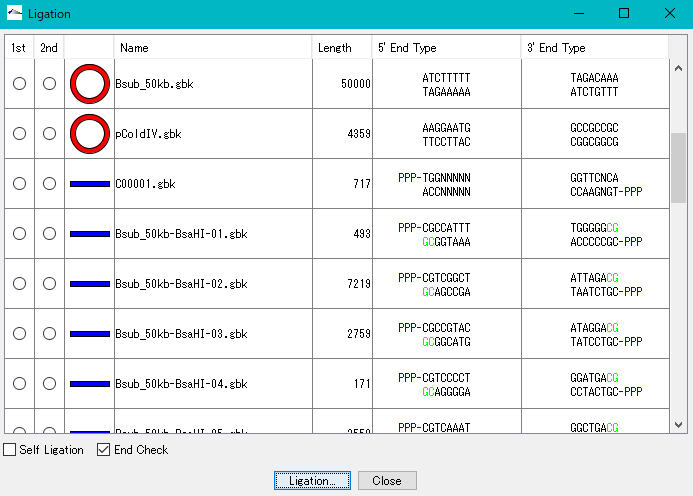
Ligation 3
Purpose and overview
- Ligation is an essential experiment to perform molecular cloning. IMC combines various nucleotide sequences including annotated nucleotide sequences with each other in the same manner as in actual cloning experiments to generate the products. All annotations are properly succeeded also to the ligation products and their products can be analyzed using many functions of the IMC as well as the original base sequence.
Function
- If the terminal sequences complementarily match each other, ligate them into one base sequence.
- Up to 5 fragment segments can be ligated.
- You can generate all possible ligation sequences.
- In Version 7.24 and later, the complete complementary sequence of the ligation product is counted as a separate product.
- Annotated nucleotide sequences of GenBank and EMBL format can be ligated as well, and these annotations are properly inherited by the ligation products.
- If the shapes and sequences of the ends of the base sequence complementarily match, a circular base sequence is generated.
- It displays a list of restriction enzymes that can be used to check the insert direction of each fragment in the generated ligation product.
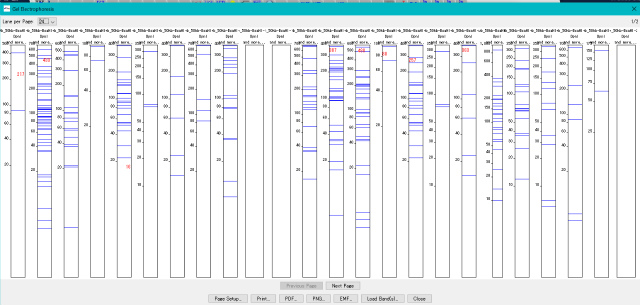
- Also displays gel electrophoresis pattern when using these restriction enzymes.
- Displays the terminal shape of all base sequences loaded in the current folder.
- Self-ligation can also generate circular DNA.
- It also supports TA cloning of PCR products.
- Before ligation, you can see the end shape of each piece.
- Plasmid map of the ligation product can be drawn. In this drawing, you can represent the insert area with a balloon
- The result of binding by ligation is a covalent bond (phosphodiester bond) equal to the bond between other bases, so after binding it can not distinguish originally.
- The base sequence generated as a ligation product can be analyzed in the same way as the original base sequence.
Restrictions
- Currently, ligation linking 6 or more base sequences is not possible.
Algorithm
- For restriction enzyme cleaved sequences on IMC, special Feature Keys and Qualifiers are generated that indicate the terminal status.
Bridge Contigs 0
When a sequence of PCR products is searched for a group of contig sequences and the PCR product bridges between two contigs, combine the contigs into one sequence.
Plasmid Map 1
For Plasmid Map creation, please see Plasmid Map Viewer.
Gel Electrophoresis 1
When DNA sequence is digested and fragmented with restriction enzyme, when PCR amplification is carried out, ligation can be displayed as results of gel electrophoresis of those products.
Fragment End Modification 0
You can modify the ends of DNA fragment sequences.
The terminal modification functions currently provided by IMC are as follows.
Molecular biological treatment
- Blunting (blunting by T4 DNA Polymerase, blunting by Mung Bean Nuclease)
- Phosphorylation
- Dephosphorylation
- Adenine overhang on PCR product
Non molecular biological treatment
- Production of sequence with protruding thymine (T-Vector)
- Attaching of restriction enzyme recognition sequence
Find RE Set for Insert Check 0
If both ends of the DNA fragment to be inserted are cleaved with the same restriction enzymes or have blunt ends by ligation etc., the optimal restriction enzyme candidate for displaying the orientation of the insert is indicated by gel electrophoresis diagram .
Homologous Recombination 0
In the genome design function, a homology arm for homologous recombination is designed from the region to be homologously recombined and the insert sequence.
This function is used to recombine the insert sequence with the designed homology arm into the genome.
Pseudo Cloning 0
Regardless of molecular biology, base sequence processing by information manipulation
- Delete Sequence: Deletes an arbitrary region of the genomic base sequence.
- Fragmentation: Cut the genomic base sequence at the specified base position (multiple designation possible) and fragmentes it.
Sequencing 0
Information on large-scale sequencing by NGS and sequencing by conventional capillary sequencer.
Data analysis of NGS can be executed with GenomeTraveler.
Capillary sequencing Data analysis can be performed with IMC.
Assembly 0
The lead sequences from the sequencer are linked to each other using homology to generate a consensus sequence.
There are large lead assembly from NGS and assembly from capillary sequencer.
Assembly of NGS leads can be done in GenomeTraveler.
The lead assembly from the capillary sequencer can be executed with the IMC tool in silico Assembler.
Nanopore related assemblies can be launched from GenomeTraveler.
NGS Read Assembly 0
It is a function to assemble the reads from the next generation sequencer (NGS).
Velvet and OASES are implemented.
This function is implemented on the following edition.
GenomeTraveler![]()
Nanopore Read Assembly 0
Assemble Reads from Nanopore Seqeuncer.
canu and miniasm are implemented.
This function can be executed with the following edition.
GenomeTraveler![]()
Assembly of Reads from Capillary Sequencer 0
Assembly function of Read from capillary sequencer.
This function is implemented in the following edition.
IMCGE![]() , IMCAE
, IMCAE![]() , IMCDS
, IMCDS![]() , GenomeTraveler
, GenomeTraveler![]()
Quality Control of Reads 0
We will control the quality of the lead from the sequencer.
We will trim out areas that are not accurate, eliminate leads that are totally inaccurate, and improve assembly accuracy.
Finishing 0
Finishing function which is the final phase of genome sequencing is explained.
Gene and Genome Sequence Analysis 7
Explanation of basic composition analysis of genes and genomes, codon analysis, ORF extraction, amino acid translation, amino acid profile analysis, motif analysis and so on.
DNA Content Analysis 1
IMC analyzes the base composition of the genome sequence.
You can perform this analysis on sequence files loaded in the current sequence directory.
The Feature Statistics function of the Genome Analysis menu outputs the base composition of all the features in the currently loaded nucleotide sequence file.
The content profile lane that can be displayed on the main feature map is also one of the functions of displaying base composition.
Changes in composition by moving average method are displayed graphically.
The content profile lane is also implemented in the circular genome map viewer.
The "Cluster Design Checker" function evaluates the base composition of the specified cluster and checks whether it is in the preset base composition range or not.
Codon Analysis 0
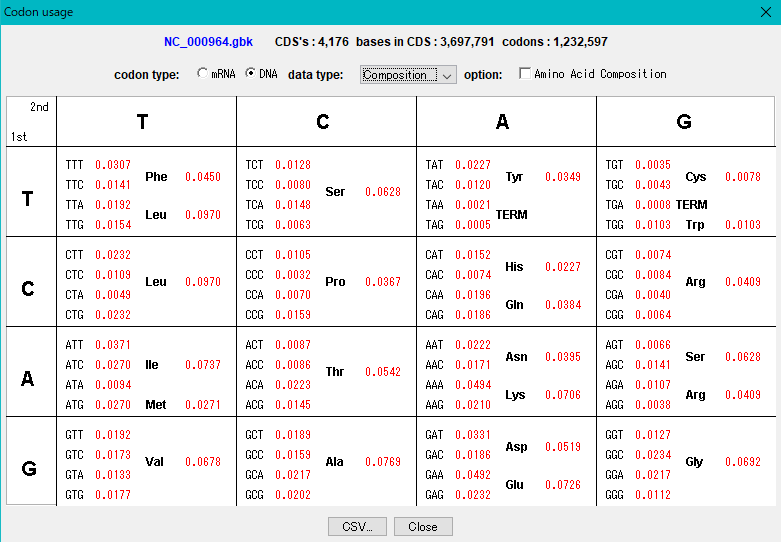
IMC outputs the codon composition and amino acid composition table of coding region (CDS).
You can perform this analysis on annotated sequence files loaded into the current sequence directory.
The "Show Codon Usage ..." function in the Genome Analysis menu not only outputs the individual amino acid composition and codon composition of all the CDSs identified in the currently loaded sequence, but also the amino acid composition of the total CDS , Codon composition can also be output.
Even with the Statistics function, the type of start codon is output for each CDS.
The codon substitution function "Change Codon" allows you to replace the codon composition according to the specified Codon Usage file.
Open Reading Frame Analysis 4
IMC provides a simple ORF candidate extraction function.
Extracts on the 6 frames of the current base sequence those having a length equal to or longer than the base length specified in the region from the stop codon to the next stop codon.
ORF candidates can be converted to CDS and amino acid translation can also be performed.
When the ORF candidate region encompasses other ORF candidate regions, one with a larger base length can be adopted.
In IMC, in addition to this, you can launch the Gene Finding programs Augustus and MetaGenome Annotator as external commands and capture the results.
In addition, you can import the output result of a gene identification program such as Glimmer and map it on the current sequence.
Translation 2
The base sequence of the CDS feature on the current base sequence is translated into amino acids.
You can specify the translation range for all CDS on current sequence, CDS on selected area, and one CDS.
Each codon is translated according to the specified Genetic Table.
Amino Acid Profile Analysis 0
The secondary structure of the amino acid sequence of the gene are shown as a profile.
Structures such as alpha helix, beta sheet, turn, etc., profiles such as hydrophilicity index, hydrophobicity index, surface quality, chain flexibility, etc. can be displayed in parallel.
Also, you can freely create a comprehensive index that linearly combines these indicators.
Amino Acid Motif Analysis 0
If a motif is registered in the motif list of amino acid profile analysis, the position of the motif can be displayed on the amino acid sequence of the amino acid profile display dialog.
Amino acid motif search can be executed from pattern search function.
Genome Annotation 7
Genome annotation is to add an annotation to the genome, more specifically, to describe the attribute (Qualifier) of the feature identified on the genome sequence.
Feature type is classified as Feature Key. The position of Feature is recorded as Position. By the Position on the genome base sequence, the nucleotide sequence occupied by the Feature can be found. In addition, coding region (CDS) translated into amino acid indirectly holds translated amino acid sequence information via Genetic Code Table. It is also important that features such as CDS are identified on either side of the double helix, and it is usually written using the position operator Complement.
Database Management 2
To execute annotation, it is necessary to create a database of nucleic acid sequences or amino acid sequences with annotations added.
IMC has a function to automatically generate a database for Blast search simply by loading the genome sequence.
This function can be used to annotate unknown genomes of closely related species.
A function of generating a large database is also implemented.
The CreateDB function generates a database for local blast search using a file of SuperKingdom that can be downloaded from NCBI and others.
The search database can generate both nucleic acid sequences and amino acid sequences databases.
These files are very large and numerous. When searching, you can join many generated databases and use them as one database name.
It is also possible to build a database on an external server so that it can be searched via the net.
Genome Annotation Tools 0
Tool group for performing genome annotation.
Mainly, the following software are used.
Many software run on Linux, so when using it on Windows, we use an external server etc.
By using Windows emulator, it can also be used in Windows PC local environment.
- CDS identification software
- rRNA identification software
- rRNA identification software
- Motif identification software
- Other
External Annotation Server 0
Since genome annotation processing requires a lot of computation time and often takes a long time, it is widely practiced to execute this on an external server and obtain the result.
In addition, the genetic identification software used for genome annotation is developed to operate on Linux in many cases, it may not be possible to run on Windows.
Even in such a case, there is the merit of installing those software on the external Linux server and annotating it.
Because Mac OS X is based on Linux, many of those identification software work directly in the local environment of the Mac.
However, also in this case manual operation may be delayed when performing manual annotation in parallel, there is a merit of annotating on the external server even on Mac.
IMC has a function to create an annotation database on an external server, and it is easy to generate a search database on the server.
Auto Annotation 1
It is a function to perform genome annotation fully automatically.
When you register a genome base sequence to be annotated, annotation to that genome sequence is performed fully automatically.
You can select the identification software to use before execution and the sequence database to use.
Manual Annotation 1
Manual annotation can be performed using the annotation function installed in the IMC.
IMC has the following annotation tools.
- Annotation Window
- Description Window
- Sequence Viewer
- Sequential number addition function to features
- Unnecessary Feature / Qualifier Removal Function
- Feature operator
- Batch homology search function
- Others
Organization and Submission Tools for Annotation 0
During annotation, we may refer to a lot of information and use special features and qualifiers.
In addition, naming and sequential number addition often become unavoidable in using temporary things in the middle of annotation.
However, when the annotation is over, much of the above information is unnecessary, and submission of annotation may result in errors.
IMC has a function to organize and refine the annotation results when the annotation is over.
The main items are listed below.
- File generation function for DDBJ large base sequence registration
- Sequential number addition function to features
- Annotation db-xref link addition function
- Removal of Feature / Qualifier
- Feature operator
- Other
Add Sequential Number to Features 0
- You can add a serial number to the features narrowed down as a search result.
- Select one of the Qualifiers that each feature has, and a serial number will be added as that value.
- Specifically, it can be operated from each search result screen of feature key search, keyword search, and genome statistical information.
- In addition, a unified serial number can be added to features on multiple selected genome sequences that are on the current main directory.
Genome Comparison 34
 |
|
Multiple Aligment 0
Make an alignment between multiple nucleic acid or amino acid sequences.
Multiple selections are possible from the sequence loaded in the main current directory.
You can also activate this function from the homology search result screen.
From the result dialog, it is possible to perform phylogenetic tree drawing function, simple editor function, copy to clipboard, print.
You can change the number of characters displayed per line.
Multiple Circular Genome Map 4
 |
Function to draw the feature and the composition of more than one related species genome in parallel on the concentric-circle. The addendum - the manipulation - a circular lane can be freely deleted from the drawing DIALOG. It is the designation only of the designation feature content imaging order alteration GenomeMap designation assignment feature in the content skew of the judgement of the chromosome base-sequence of more than one designation in the feature of the judgement of the chromosome base-sequence with more than one annotation. Independent color setting by the concentric-circle.
Implemented Editions: |
Multiple Linear Genome Map 5
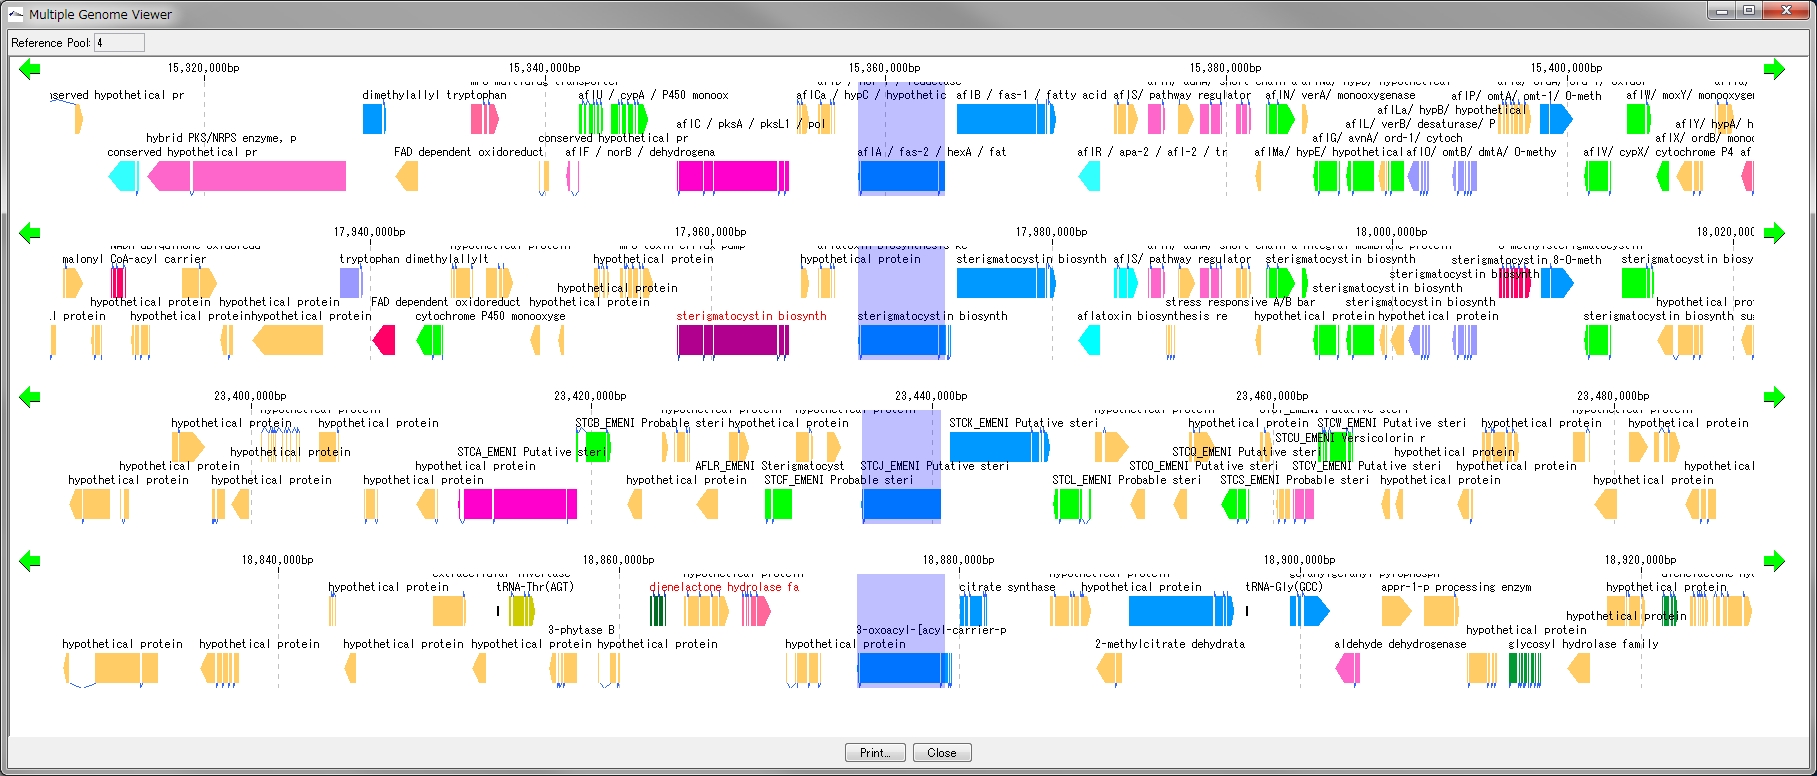
This function is installed in the following software
IMCGE
IMCAE
GenomeTraveler
- Multiple Linear Genome Map (Multiple Linear Genome Map) is a function to comparatively draw Feature from multiple genomic chromosomes between closely related species in parallel.
- Homology search can be performed on all the features on other genomes by right clicking one feature on the multiple linear genomic map and if that feature has homologous clan strings on other genomes, homologous genes Alignment can be displayed on the axis.
- "IMC O10 Gene Cluster Alignment" can be executed by right mouse click from multiple linear map.
- You can output files in PDF, PNG, and EMF image formats.
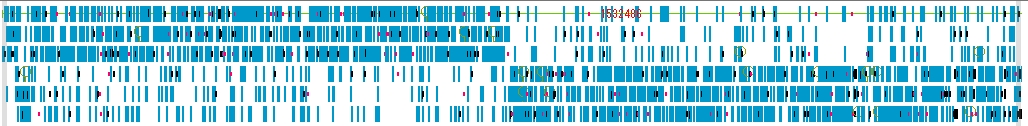
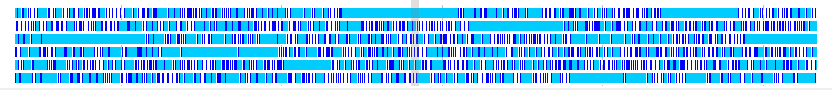
Dot Plot Analysis 5
- This function is implemented in the following editions.
- IMCGE
 , AE
, AE , DS
, DS , GT
, GT
- IMCGE
- We display homology regions between two genomic sequences in dot matrix.
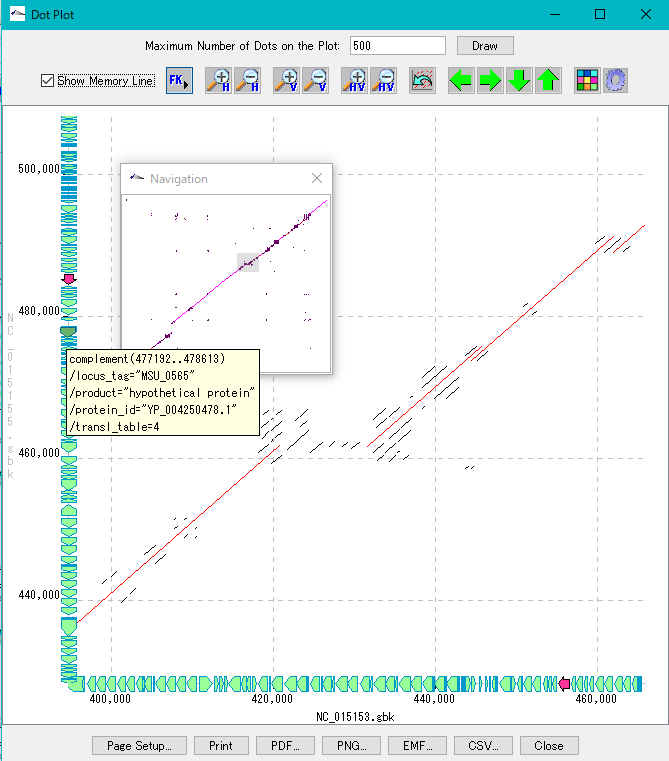
- Select and compare the current genome sequence and one genomic sequence loaded in the current reference directory.
- You can set dot color by Overlap base length,% Identity level.
- In the result display window, zooming, shifting, enlarging an arbitrary region selected by rectangle, dot color setting, navigation window, restriction on the number of display dots, and feature key display (display of annotations with feature - mouse-over) are possible.
- A dot image can be output as a file in PDF / PNG / EMF format, and print setting is also possible.
- The dot list can be output as a file in CSV format.
Venn Diagram Analysis 10
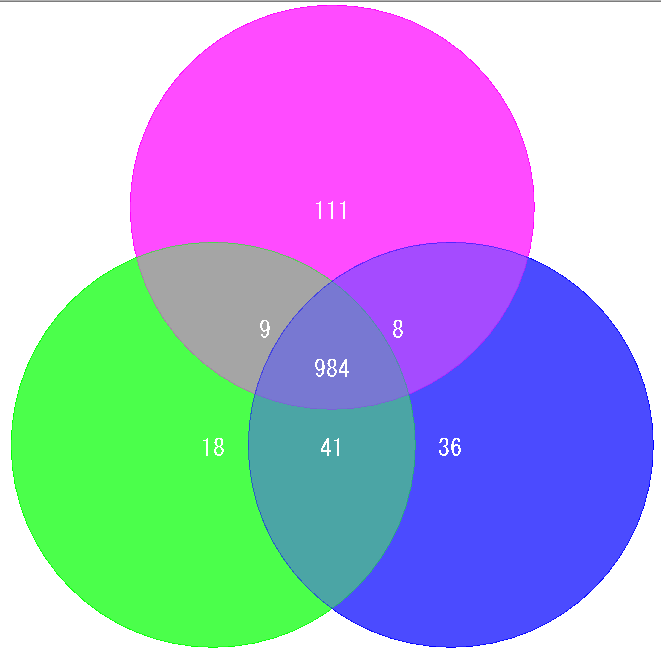
Venn Diagram is a diagram used in set theory, showing the distribution of the number of elements between 3 sets (4 or more sets can be drawn, but IMC draws only 3 sets or less) It is.
Elements belonging to each set are shown in the circle, and overlapping parts are shown as common elements.
It is used for biological applications to illustrate the number of orthologous or unique genes between closely related genomes.
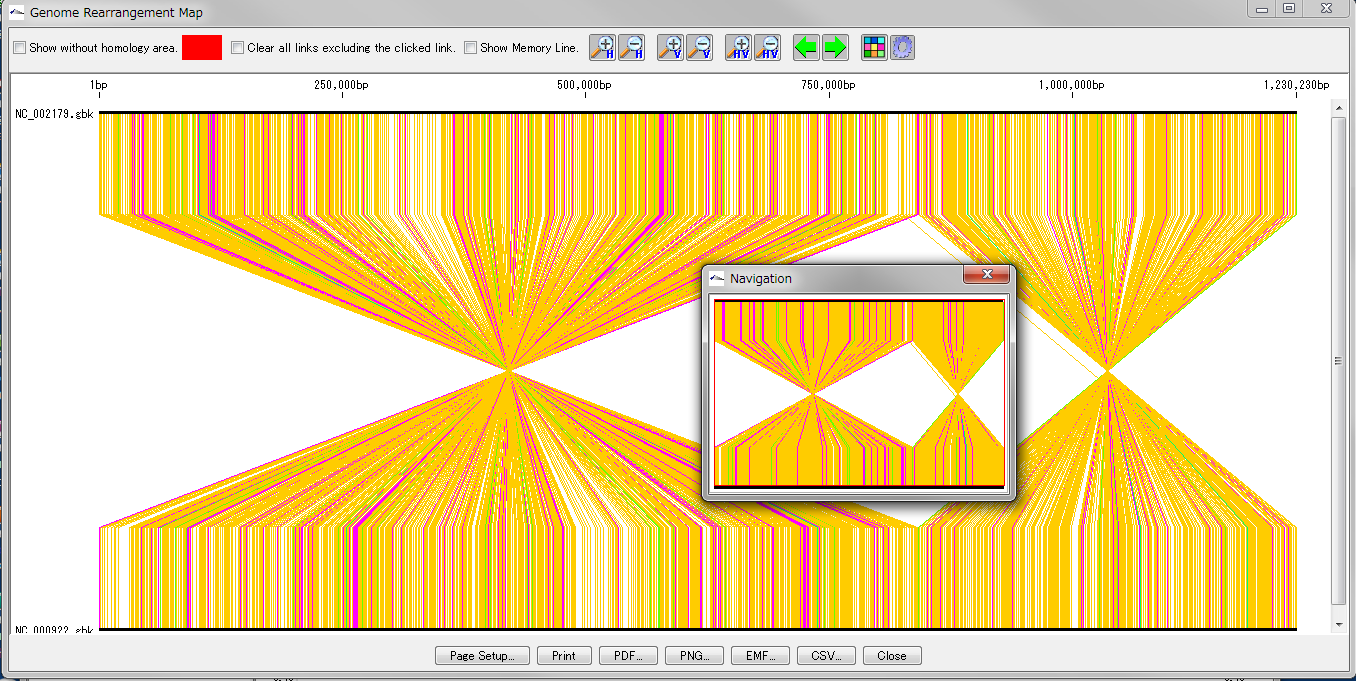
Global Genome Rearrangement Analysis 0
Drawing window for global genome rearrangement map. Genomic sequences that are closely related to each other are represented in a straight line at the top and bottom. Many colored line segments that connect the upper and lower line segments are highly homologous in the upper and lower genomes. The color of the line connecting the top and bottom shows the difference in the strength of homology. The line that gathers at one point in the center indicates that this basin is inverted in each other's genome. A small window in the center shows what is displayed when you zoom in on the whole in the navigation window. Screen display and output can be set with the button tools at the top and bottom.
This feature is implemented in the following software editions
- IMCGEIMCAEIMCDSGenomeTraveler
Overview and functions
Create and draw a genome rearrangement map across the entire length of related species genomes at the feature level.
Compares the total genome length pairwise between the current genome sequence and the selected (several) genome sequences among the related species genome sequences loaded in the current reference directory.
Comparisons with nucleic acid sequences and amino acid sequences are possible. The criteria for determining homology can be changed.
For comparison by amino acid sequence, both genomes must be annotated with CDS.
From the result screen, you can zoom in and out, scroll, pick up homologous lines, display arbitrary feature keys, display non-homologous regions, and display a navigation window.
Result images can be output in PDF / PNG / EMF format. The homology list can be output as a file in CSV format.
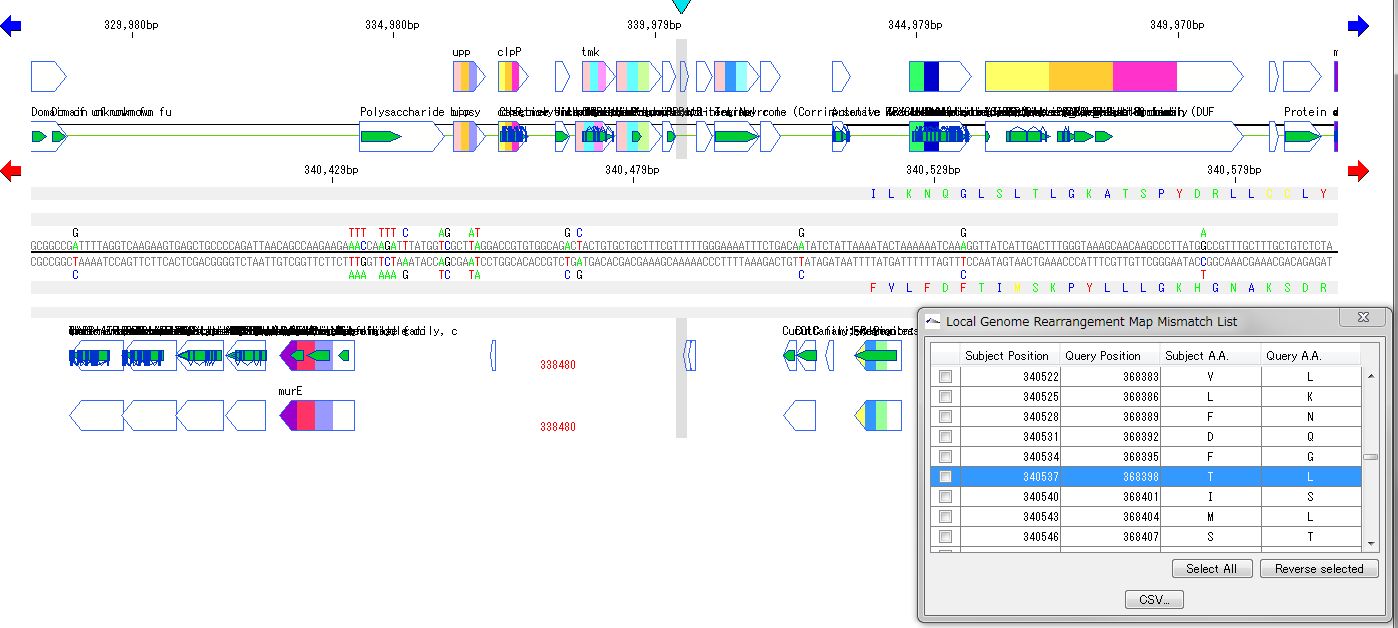
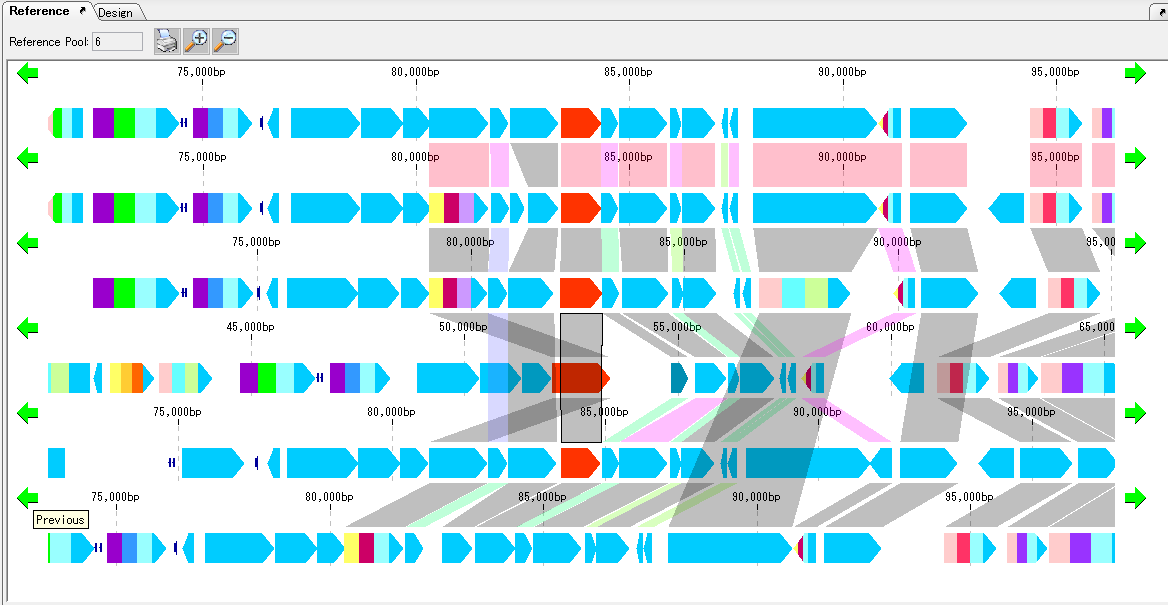
Local Genome Rearrangement Analysis 4
What is a local genome rearrangement map?
The local genome rearrangement map (Local Genome Rearrangement Map) is one of the functions to compare closely related species. A comparison of homology regions along the maximum homology path between two genomes is displayed at the base sequence and amino acid sequence level and annotations on those genomes are displayed.
Features
Detect homologous regions with different closely related genomes on the reference genome and draw a local genomic rearrangement map in which the nucleotide sequence and the features of each genome are aligned. I call this function the local genome rearrangement map.
We create and draw a local genomic rearrangement map across the two closely related species.
For the reference genome, we map the entire genomes of closely related species to be compared.
It displays the homologous region at the base sequence level throughout the genome between the two genomes.
In the coding region, corresponding amino acid residues are aligned.
You can move the map to the corresponding position by listing the mismatch points of amino acid residues and clicking on each mismatch point in the list.
A list of coincident parts and residues can be output as a CSV file.
The list will be reproduced and displayed when reloading.
In the homologous region, the features of both genomes and their positions are aligned.
For regions where there is no homology with the reference genome, the features of the comparison genome will not be displayed.
This is judged from the principle that the LGRM maps the comparison genome to the reference genome, as a region which is not mapped, that is, a region deleted from the comparison target genome.
Analysis results can be saved and re-browsed as GenBank format files of the reference genome.
LGRM display setting can be registered as layout style (LGRM lane).
The LGR Map lane can be placed at any position in the main feature map.
You can customize comparison display of base sequence and amino acid sequence
LGRM reads ordinary array lane for LGRM and uses it.
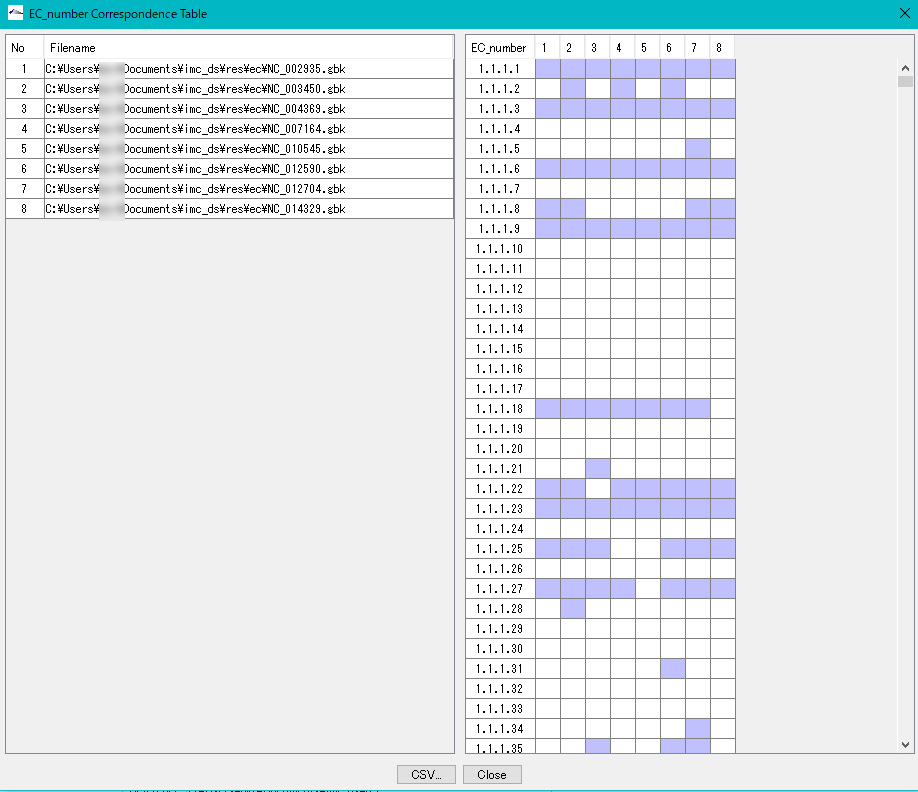
Enzyme Alignment by EC Number 0
Displays a control list of EC numbers annotated to the CDS present in each genome from multiple annotated genomic base sequence files.
- Nucleotide sequences that do not have an EC number added to the annotation can not be analyzed.
- Extract the EC number in Feature of the analysis target file.
- Create an existence list in ascending order of EC numbers.
- Specify two or more GenBank / EMBL format files.
- EC_Number The Correspondence Table window is displayed.
- You can output this content as CSV format file.
Gene Cluster Alignment 3
Gene cluster alignment focuses on one gene of a plurality of closely related genomes, and includes the vicinity thereof (N gene ranges in the upstream and N gene ranges in the downstream), and the relationship between the closely related species genome
The presence or absence of homology is investigated, and when there is BBH, homologous genes are combined and displayed in bands.
The homology score allows you to change the drawing color of the binding band.
For alignment display, use the reference feature map (multiple genome viewer).
Each genome can be scrolled left and right individually.
It is possible to zoom the whole.
If you change the display order of genome, clustering will end.
To print, use the Print button. You can dock out this pane.
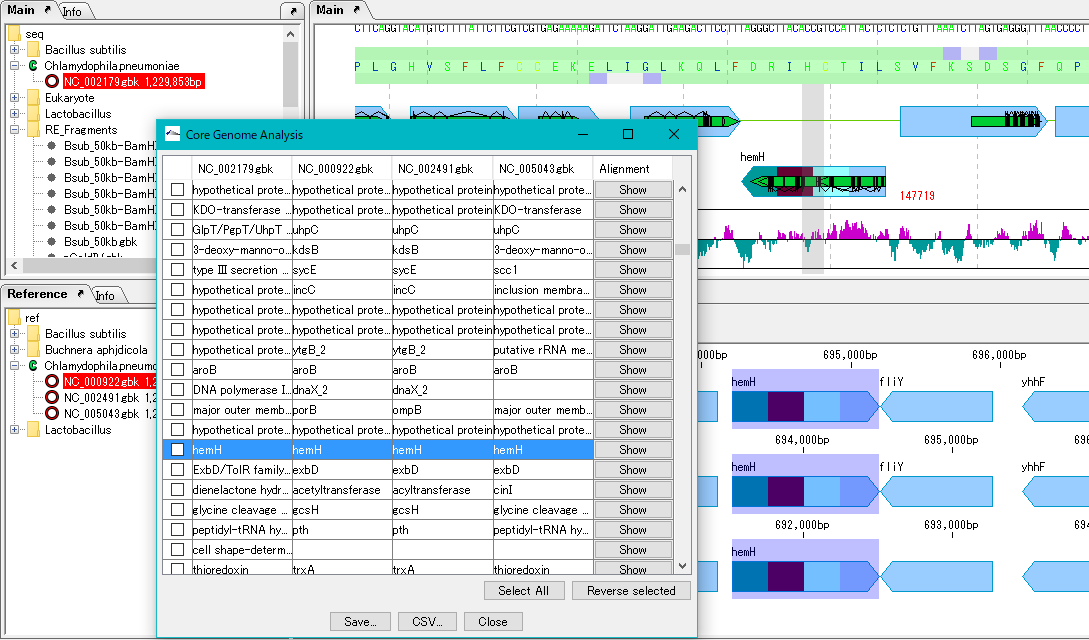
Core Genome Analysis 1
Extract the core genome from the pan genome.
Specifically, common genes are extracted from closely related genomic populations.
It is possible to save analysis results in a file.
Once you have finished IMC, you can load this file and continue the core genome analysis.
Calculation time is required if the group is large.
In that case, we recommend running on a computer with a large number of cores.
Implementation edition: IMCGE![]() , AE
, AE![]() , DS
, DS![]()
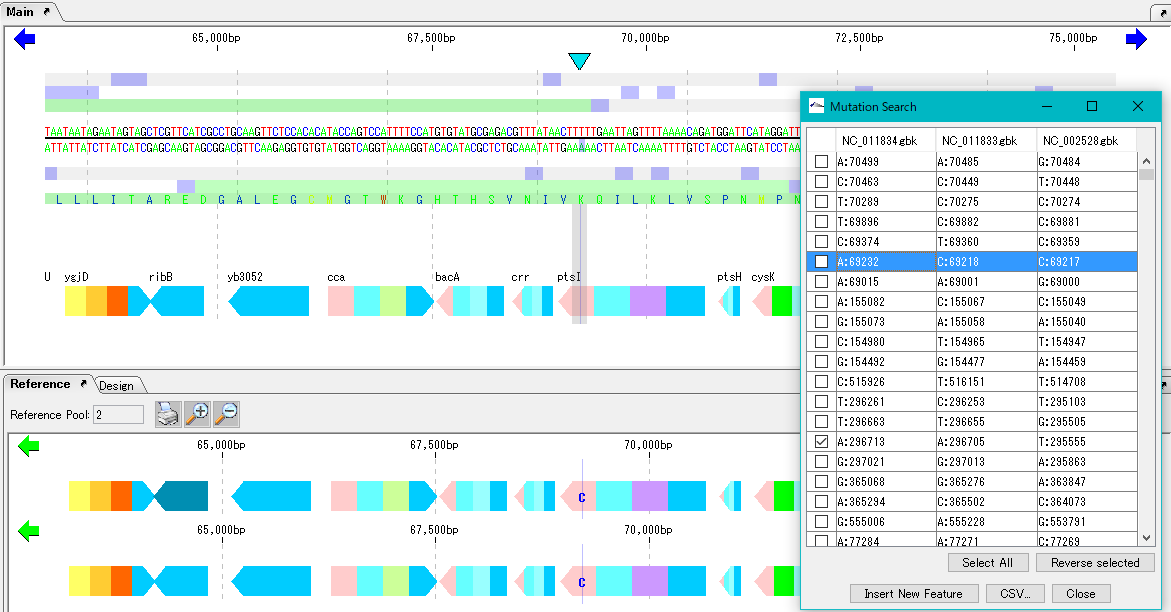
Mutation Search 1
Mutation point analysis detects mutation points between related genomes (pangenomes) in base units.
- Based on the current genome sequence, you can select and compare two or more from the genomic sequence loaded in the current reference directory.
- The genomic sequence must be genetically extracted and the CDS feature must be registered.
- Mutant bases can be displayed on the reference feature map.
- The detection site can be set on CDS or intergenic region.
- In the case of the intergenic region, the accuracy drops.
- For detection criteria, you can change% Identity and Overlap rate.
- A list of mutated bases is displayed on the analysis result screen, and the display items are mutated bases, mutation positions, gene names, ocus-Tags by genome sequence.
- Results can be output in CSV format.
- Increasing the memory size will also increase the analyzable pan genome size.
- Calculation time is required if the group is large. In that case, we recommend running on a computer with a large number of cores.
Implementation edition: IMCGE![]() , AE
, AE![]() , DS
, DS![]()
Phylogenetic Tree 0
From the multiple alignment result, draw the molecular phylogenetic tree of the selected feature.
You can specify horizontal display, vertical display, and rootless tree. It is also possible to show / hide the evolution distance.
You can select the shape of the node from Box, Circle, None.
A phylogenetic tree diagram can be output as a file in PDF format.
You can read and display the phylogenetic tree file (dnd format) created externally.
Genome Mapping 3
It is possible to map various sequences onto genomic base sequence (s) and register them as features.
Mapping possible sequence files
- EST / cDNA base sequence file
- EST / cDNA nucleotide sequence file on multiple genome sequences
- Amino acid sequence file
- dbSNP file
- JSNP file
- ABI / SCF trace file
- Tiliing Array probe sequence file
- Affymetrix
- Nimblegen
- Agilent
- PCR primer sequence
- Restriction enzyme recognition sequence
Feature Mapping 0
Feature mapping is the function of mapping the exported feature data onto the genomic sequence and registering it as a feature of its genomic sequence.
As a method of identifying the position to be mapped, there is a method based on the position information of the feature and a method of identifying the position by homology search using the base sequence of the feature.
EST Mapping 0
EST (cDNA) mapping refers to the mapping of EST (cDNA) sequence file to the reference genome base sequence by using its homology to identify the genomic position from which EST is derived and registering the EST (cDNA) feature at that position.
Depending on the EST library, local redundancy may be high, and many EST features may be mapped to the same site on the genome.
To draw such locally highly redundant EST mapping results on the feature map, there is a feature layout feature called Pack Lane. (For details, please refer to FLS: Feature Layout Style, Pack Lane.)
There are two types of EST mapping.
- Method of mapping on the base sequence displayed in the current main feature map
- Method of designating a plurality of genome base sequences and mapping them to a plurality of specified base sequence files
Trace Mapping 0
Trace mapping is a function to map the trace waveform data from the capillary sequencer onto the genomic base sequence from which it is derived.
Using the trace waveform viewer, you can view the aligned trace waveforms.
SNP Mapping 1
It is a function to map mutation data of gbSNP or jSNP onto the corresponding genomic base sequence.
Amino Acid Sequence Mapping 1
Map the amino acid sequence on the reference genome base sequence and register it as a new feature.
It maps the specified amino acid sequence (s) to the reference genome currently displayed as a feature map and registers the hit entry as a new feature (such as mRNA).
For the mapping, the tBlastN algorithm is used.
Mapping results are classified into three types.
- When the input amino acid perfectly matches the reference genome base sequence
- When the input amino acid incompletely matches the reference genome base sequence
- When the input amino acid sequence does not match at all
Results of the former two types can be registered as new features on the reference genome. For example, a perfect match sequence can be registered as an mRNA feature and incomplete match sequences can be registered as miscRNA features.
You can set the same Value for any Qualifier of the newly registered feature. In addition, it is possible to register sequential numbers starting with arbitrary numbers, with the prefix specified in Qualifier / locus_id and any number of digits.
In the case of a eukaryote with an intron, it is registered as a feature by identifying the exon-intron region.
You can limit the maximum base length of introns.
Array Probe Mapping 0
Before performing array analysis, it is necessary to map the tiling array probe to the target genomic base sequence and register the position and information on the genome of each probe as a feature.
Expression data of the array is obtained for each probe, so when loading the expression file, individual expression level information is posted on the features of each probe.
BLAST Result Mapping 0
In IMC, Blast search results of each CDS feature identified on the genome sequence can be saved as qualifiers of each feature.
These results of homology search can be written on qualifiers of each CDS feature by mapping the result of Blast search on an external server or the like to the current genome sequence using the Blast search result mapping function.
You can correctly map Blast search results by exporting Feature Key Search results in advance and using them as a query sequence.
NGS Read Mapping 1
This function maps the Read of Next Generation Sequencer (NGS) on the reference genome sequence.
It is implemented in the following software.
GenomeTraveler![]()
Expression Analysis 2
- High-precision tiling array data can be browsed and analyzed in conjunction with annotations of genes etc. Affymetrix, Agilent and Nimblegen arrays are supported.
- Array profile parallel display (corresponding to layout style)
- Array data correction, array information statistics (graph creation)
- Array-to-array operation, Save calculation result file
- Probe level - Gene level expression intensity conversion
- Clustering by expression intensity by genes (between genes)
- Profile peak detection
This function can be executed with the following edition.
AE![]() , DS
, DS![]() , GT
, GT![]()
Probe Design 0
Automatically design tiling array probes.
You can specify the probe base length.
You can specify the distance (base number) between the leading bases of each probe.
You can specify the strand to design the probe (Forward Strand, Reverse Strand, Both). Probes can be designed avoiding specified annotations (feature keys) such as rRNA.
If there is any annotation at the position where the probe was designed, it is possible to capture its contents.
An arbitrary initial letter (prefix) and a sequential number of the specified number of digits can be specified for the probe name.
Currently it is possible to output in three different formats.
- Agilent Simple Format: Agilent Simple Format is a comma-separated CSV format of 2 columns per row consisting of ProbeID and Sequence.
- Agilent Complete Format: The Agilent Complete Format is a comma separated CSV format of 7 columns per probe consisting of ProbeID, Sequence, TargetID, Accessionns, GeneSymbols, Description and ChromosomalLocation.
- IMC Standard CSV Format: IMC Starndard CSV Format is a Comma Separated Probe Description CSV Format of 5 columns per row of 1 probe standardly used by IMC.
This function can be executed with the following edition.
AE![]() , DS
, DS![]() , GT
, GT![]()
Probe Mapping 0
This is a function to map a probe to annotated nucleotide sequence file.
You can read the probe file and map it to the origin position on the current genome sequence.
When there is position information on the genome, paste the probe feature to the corresponding genome position based on the position information of each probe.
If position information does not exist and only the base sequence of the probe is given, mapping is performed based on the homology of the probe base sequence.
Currently mappable probes belong to the following array makers.
- Affymetrix
- Agilent
- Nimblegen
This function can be executed with the following edition.
AE![]() , DS
, DS![]() , GT
, GT![]()
Import Expression Data File 0
Import tiling array expression data files and NGS RNA-Seq files so that they can be used for array expression analysis.
There is no limit on the number of expression data files that can be imported, but you can only import 10 files with one operation.
Probe mapping must be performed before this function can be executed.
You can load a genome base sequence file, map a probe file, import a expression data file, register it as a batch process, and execute it in the background.
The expression level for each probe can be displayed as a bar graph or a line graph on the array profile lane of the main feature map.
There is no limit on the number of lanes to display at the same time, but as you increase the number of lanes, it consumes more memory.
Expression Profile Lane Operations 2
Any number of expression profile lanes can be displayed on the main feature map.
Also, you can move its position freely up and down.
Expression profiles belonging to that region are also inherited if genomic sequences with expression profiles are digested, truncated, amplified, ligated, etc. by cloning operation.
This function is installed in the following software edition
IMCAE![]() , IMCDS
, IMCDS![]() , GenomeTraveler
, GenomeTraveler![]()
On the expression profile lane you can perform the following operations.
- Setting lane style
- Import color data
- Clear color data
- Output CSV format file of expression profile
- Profile Magnified
Expression Data Correction 0
This function corrects the expression profile data.
Data correction functions include the following.
- MM Subtraction from PM
- Quality Trimming
- Saturation Trimming
- Global Rank Trimming
- Global Rate Trimming
- Base Window Rank Trimming
- Probe Window Rank Trimming
- Probe Window Rate Trimming
- Border Line Trimming
- Base Window Rate Trimming
- R-I Conversion
- Level Conversion
- Trimmed Mean
- Trimmed Median
These data corrections are pipelined to execute multiple correction items in an arbitrary order.
The applied state of these data corrections is shown on the list displayed for each expression data file.
A statistical number of correction values of the results of these data corrections can be displayed in a list for each expression data file.
The distribution of the expression levels before and after the data correction can be displayed in a graph.
This function can be executed with the following edition.
AE![]() , DS
, DS![]() , GT
, GT![]()
Gene Level Data Conversion 0
Lengths of probes of tiling arrays are usually shorter than genes, and multiple probes are designed at approximately equal intervals on genes and between genes.
In addition, the measured primary data is the expression level for each probe.
Therefore, focusing on one gene, multiple probes and multiple expression levels can be obtained there.
This function converts the expression level of the probe placed on the gene into the expression level of the gene.
This function can be executed with the following edition.
AE![]() , DS
, DS![]() , GT
, GT![]()
Inter-Array Analysis 0
This function can be executed with the following edition.
AE![]() , DS
, DS![]() , GT
, GT![]()
Peak Detection 0
Detect peaks from the expression profile.
Detection results are listed in the Peak List dialog.
The list can be saved as a CSV file.
When you click on the list, the main feature map will automatically scroll so that its position is centered.
This function can be executed with the following edition.
AE![]() , DS
, DS![]() , GT
, GT![]()
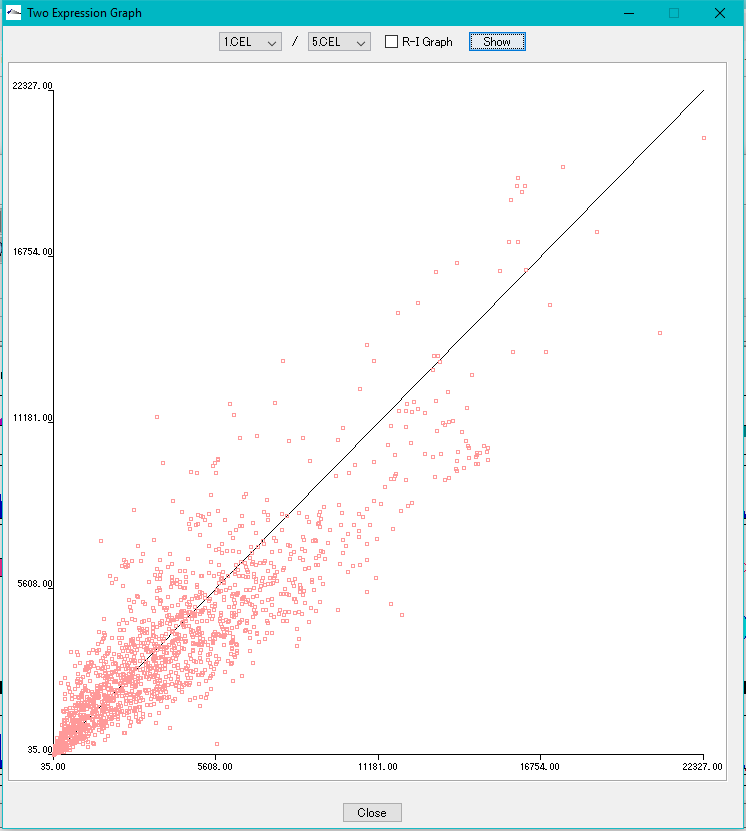
Correlation Plot between Arrays 0
Plot the correlation of expression levels between arbitrary arrays.
- X-Y plot
- R-I plot
This function can be executed with the following edition.
AE![]() , DS
, DS![]() , GT
, GT![]()
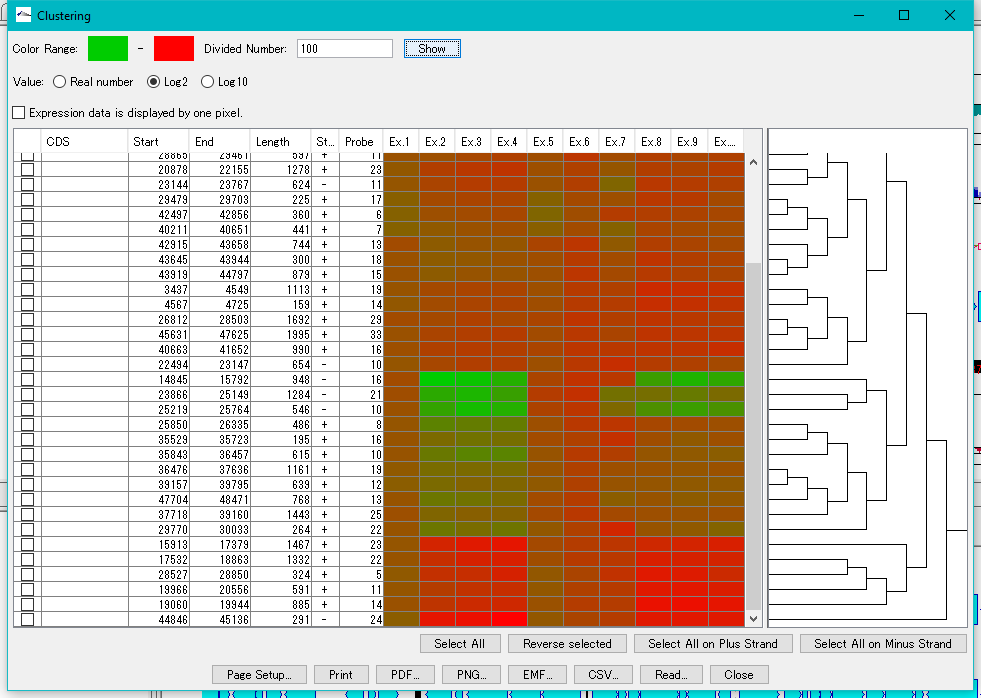
Expression Clustering 0
Clustering of gene expression levels.
Clustering results can be displayed as dendrograms and heat maps.
This function can be executed with the following edition.
AE![]() , DS
, DS![]() , GT
, GT![]()
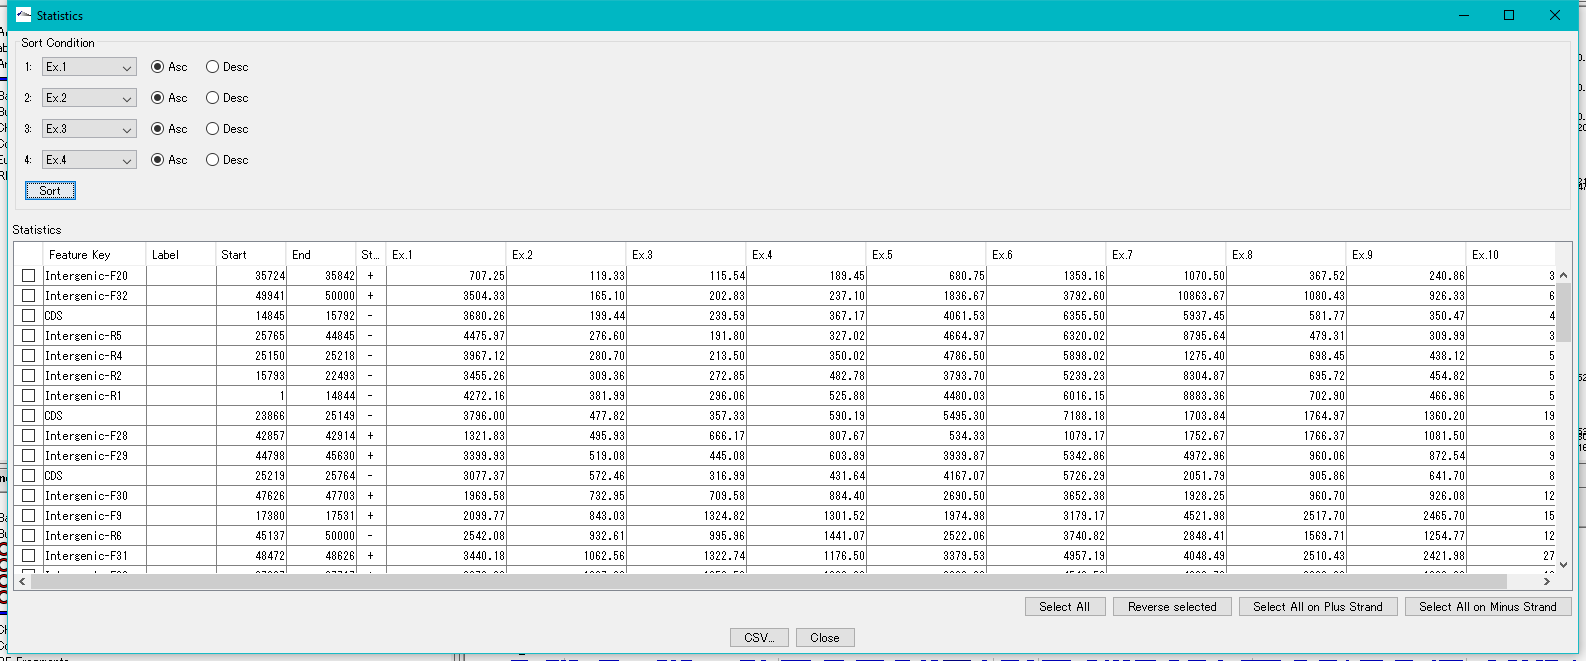
Feature Expression Statistics 0
As for the presently imported expression level data file, the expression levels by feature are listed.
Features to display in the list dialog can be selected (multiple selections possible).
The list can be sorted with up to four sort keys per column.
This function is implemented in the following edition.
AE![]() , DS
, DS![]() , GT
, GT![]()
Arithmetic Operation between Arrays 0
Arithmetic operation between arrays is executed, and the result is displayed in the profile lane.
It is possible to calculate up to 3 arrays.
This function can be executed with the following edition.
AE![]() , DS
, DS![]() , GT
, GT![]()
Metabolomics 2
Local Pathway Builder 0
Local Pathway Builder is a tool that uses the information contained in the loaded genome-scale model to extend metabolic pathways one reaction at a time.
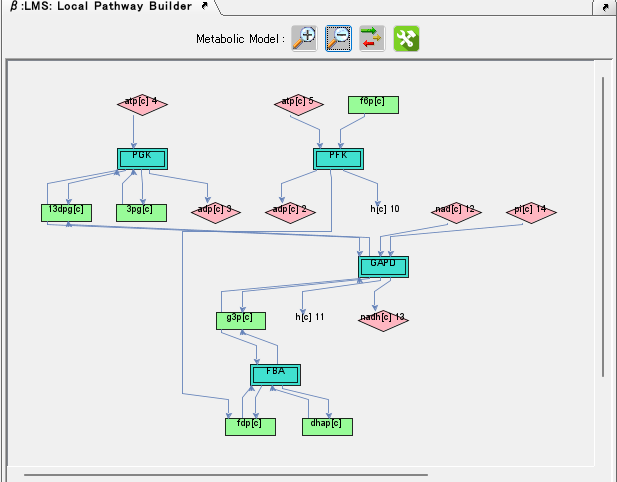
Genome Design 5
Codon Adaptation Design 0
On the design of gene composition for recombination into heterologous host
Codon substitution
Composition automatic design
Gene Design 0
On the design of gene level
Gene Cluster Design 0
- Functions to align gene clusters
- Gene Cluster Alignment
- Gibson Assembly, In-Fusion Cloning etc., primer automatic design function for gene cluster construction
- Cluster Designer
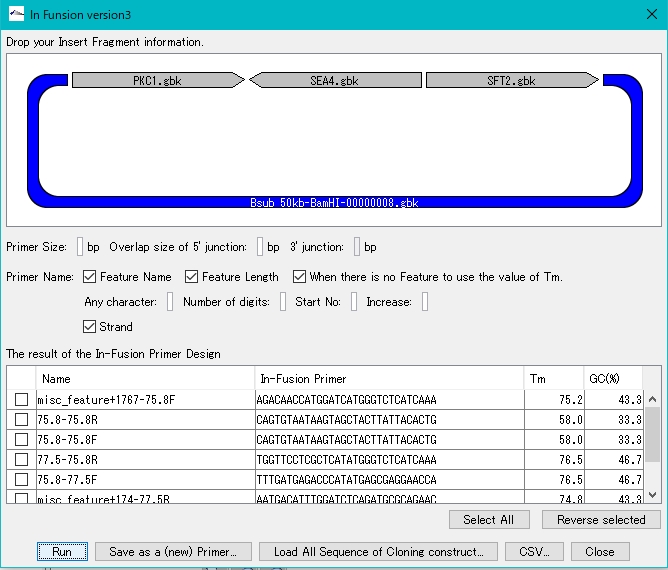
- Automatically design Combinatorial Cluster
- Combinatorial Designer
Gene Cluster Design Check 0
It is a function to check if the gene cluster is designed correctly.
- Does it possess a gene composition, codon composition that matches the composition of the host
- Is the start codon and the stop codon correct?
- Is there a required array?
- Restriction enzyme recognition site
- RBS
- Homology Arm
- Is there an unnecessary array
- Restriction enzyme recognition site
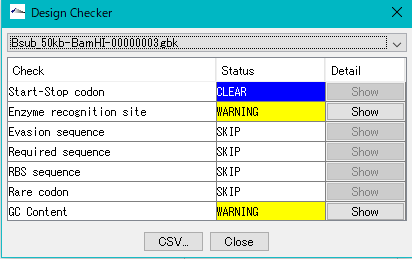
Reverse Complement 3
- Convert the current sequence, including all the features, into an arrangement that uses the reverse complementary strand as it is, and the feature map also turns around with the reverse complementary strand in order and is displayed.
- The reverse complementary strand converted sequence can be output in that state.
- The tool button becomes the toggle display of the reverse complement button, and once it is executed again, it returns to the original chain.
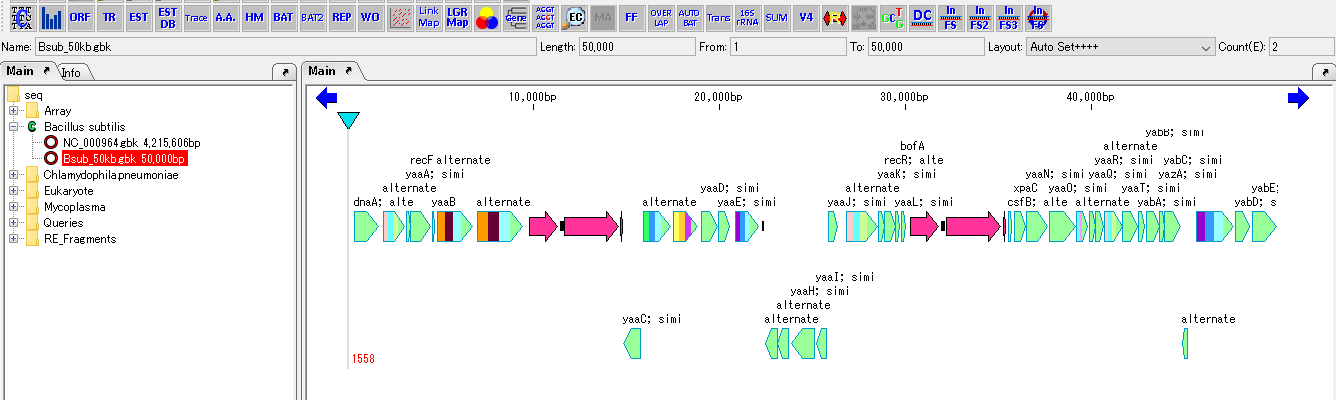
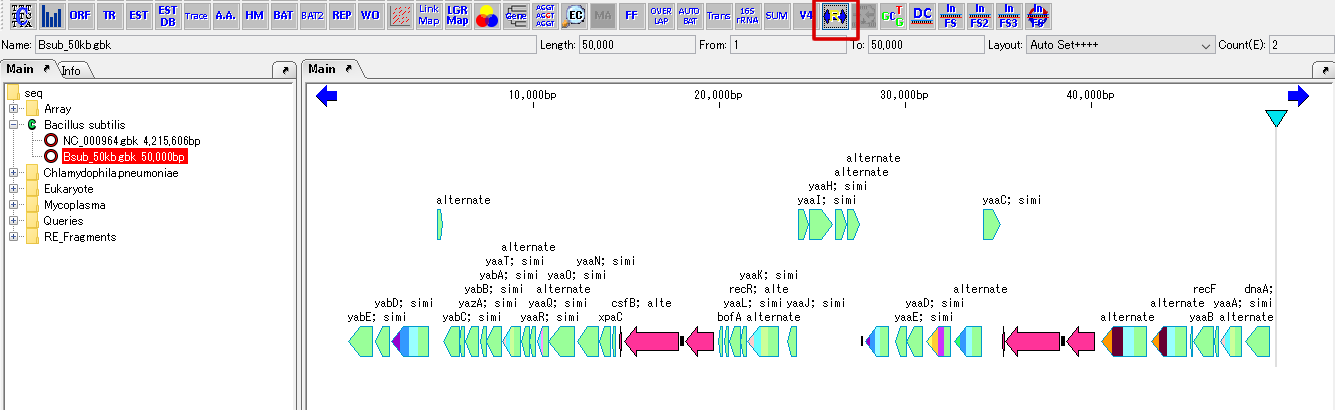
Cluster Fragmentation Design 1
Gene cluster sequence fragmentation design to reconstruct cluster by OGAB method.
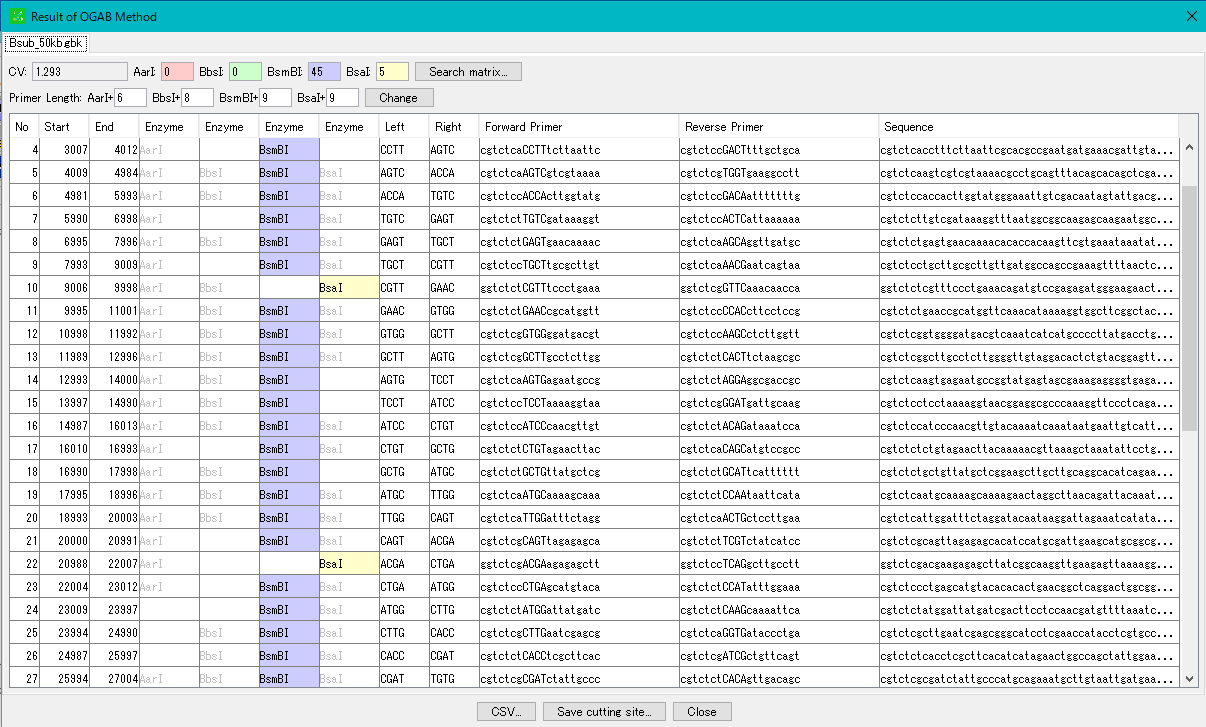
Homologous Recombination Design 0
Design homology arms for homologous recombination and PCR primer design for amplification of homology arms.
After designing insert sequences and homology arms, actually perform homologous recombination into the genome.
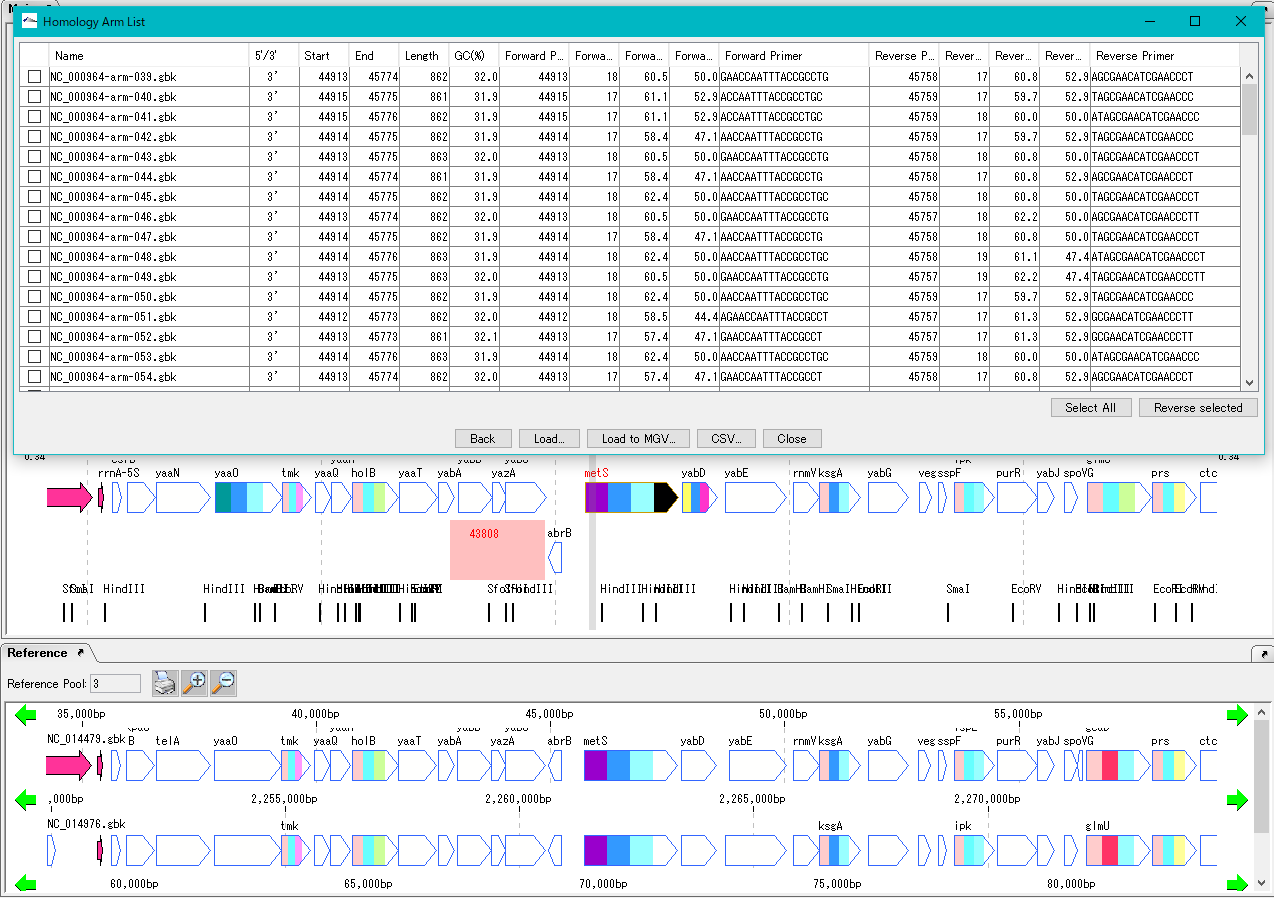
Settings 14
Parameter Setting 9
Change various parameter settings.
Window Dialog Description 15
Description of Windows and Dialogs.
Execution Dialog 2
Dialogs that instruct execution such as analysis.
Parameter Setting Dialog 11
Dialog for setting optional parameters such as execution and display.
Result Display Dialog 1
Dialog for displaying search results and analysis results.
Major Windows of IMC and GT 0
Main Window of IMC
Start Window
- This window is displayed when IMC starts.
- The version and license information will be displayed.
Main Window
- Main window for editing, annotating, and analyzing genome sequences.
GenBank / EMBL Viewer
- Browse files in GenBank or EBML format as they are.
Sequence Viewer
- Browse the current genome sequence in various formats.
Annotation Window
- This is a window for annotation.
Circular Genome Map Viewer-Editor
- This window is used to create a circular genome map.
Plasmid Map Viewer-Editor
- This window is for creating a plasmid map.
Trace Chart
- This window displays ABI / SCF format chromatography.
Lab Note
- This is the IMC operation record window.
HELP Window
- Help window in ISB format.
- Help and manuals are updated more quickly on the website.
Main windows of GT
Start Window
- This window is displayed when GT starts.
- The version and license information will be displayed.
Main (Project) Window
- This window manages projects and analysis results registered in GT.
Alignment Window
- This window displays the results of GT analysis alongside the genome sequence and annotations.
Other:
- Most windows of IMC can be displayed from GT.
Attached tools window
iSpider Window
- This window is used to automatically download genome databases such as GenBank and EMBL.
TaxiSpider Window
- It is a window to easily obtain the target genomic sequence and amino acid sequence by tracing the Taxonomy Tree.
ARM Window
- This window is for searching and drawing metabolic pathways.
Tools 4
in silico Assembler 2
in silico Assembler is de novo Assembler.
You can assemble DNA fragments of 50 bp or more.
It is mainly used for assembly of fragment reads from capillary sequencer.
Reads from NGS can also be assembled (up to 1 million reads, please use Velvet etc for larger size).
In the preprocessing, limited number of processing, designation of minimum QV, maximum N bases can be limited.
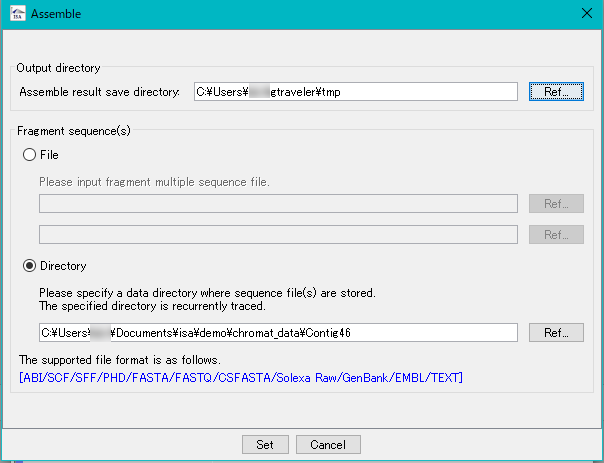
iSpider 0
iSpider is a tool for downloading necessary sequence data files from various external sequence database servers.
By registering information of the external servers and the sequence data files acquired from it in advance, you can easily download the latest sequence data and save it in the specified local directory.
Although it is possible to execute the download immediately manually, it is also possible to specify the date and time to execute and download it automatically at that time.
Because it is possible to specify multiple files with regular expressions, in some cases you will download quite a lot of files.
Please do not load much load on the servers according to the rules of external server.
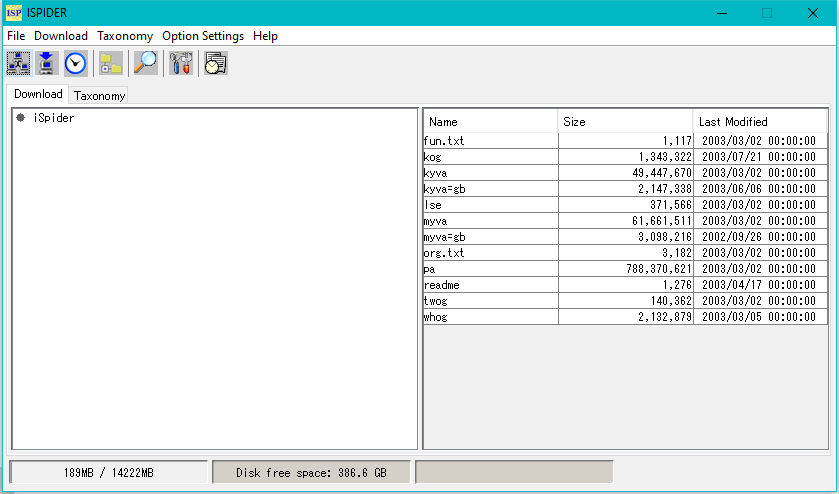
TaxiSpider 0
TaxiSpider is a sister tool of iSpider.
It is a tool to download all the indexes to the base sequence file and the amino acid sequence file from the specified site, but it is characterized by storing those array indexes in one big Taxonomy Tree like database.
The downloaded array data is stored on the corresponding branch of Taxonomy Tree according to its Taxonomy information.
However, it requires very large disk space locally.
As of December 2018, 47 GB of space is required.
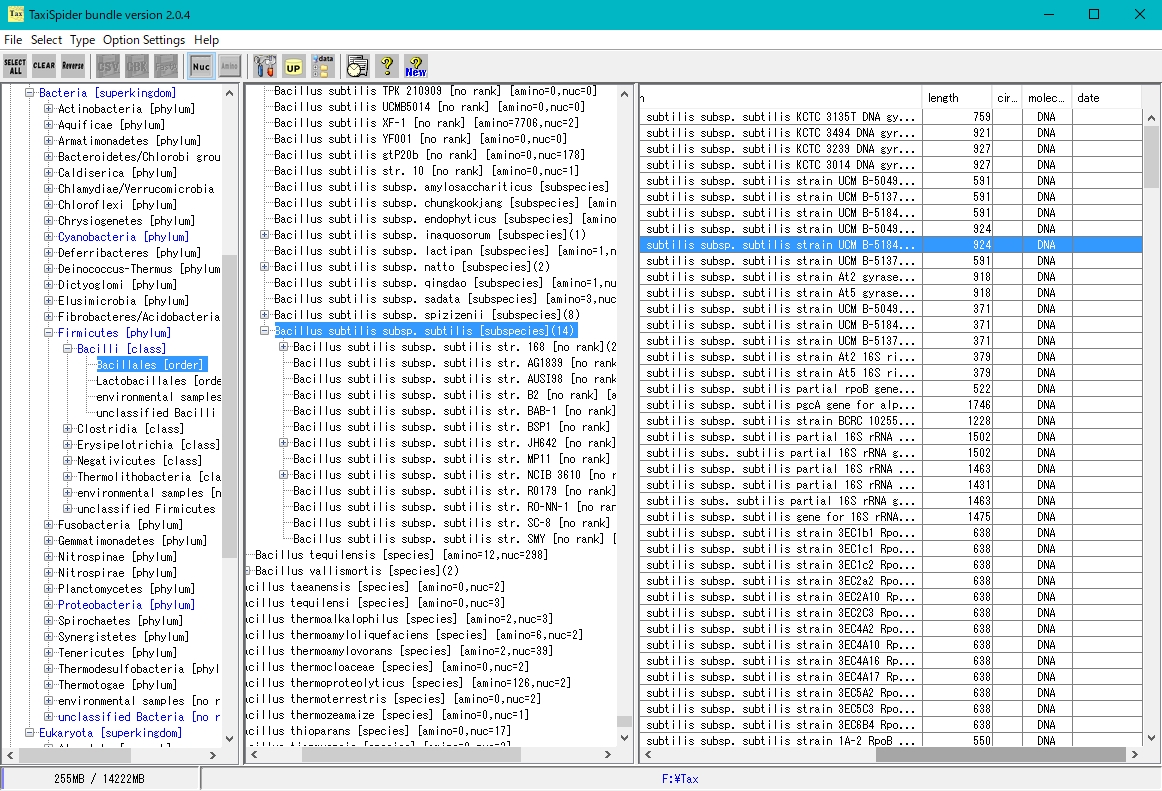
ARM 0
ARM is a metabolic pathway editor / viewer.
There is an atom trace function, which can track carbon, oxygen and sulfur atoms.
You can search all single pathways from source compound to target compound.
However, since the compound and reaction data are old, the latest pathway is not included.
It is possible to add compounds and reactions.
You can combine the searched pathways automatically on the canvas and draw a synthetic pathway.
The following new functions are also added to the original function.
You can import quantitative data for each compound obtained from metabolome analysis, etc., and display the series on each compound (bar graph).
In addition, expression level data of enzyme genes obtained from transcriptome analysis can be displayed in series (bar graph) on each reaction.
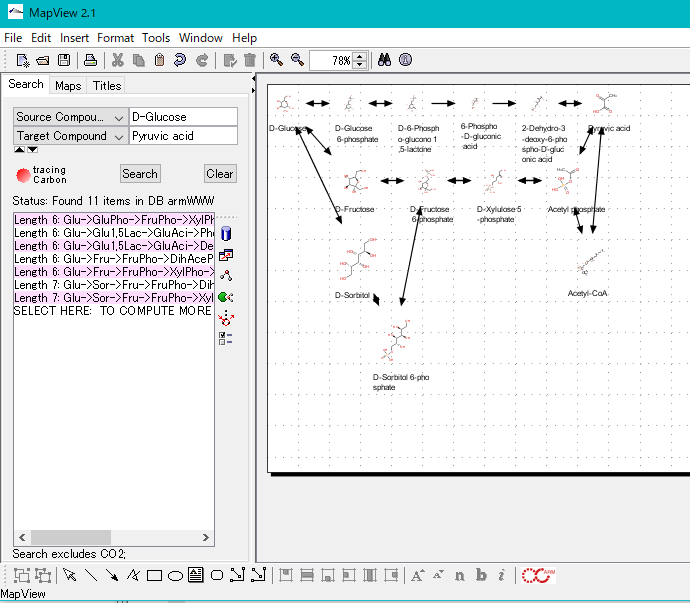
ARM is software developed by Prof. Arita of the University of Tokyo (present National Institute of Genetics).
Interactive ARM 0
It is an interactive ARM interface.
You can run ARM's single pathway discovery function interactively.
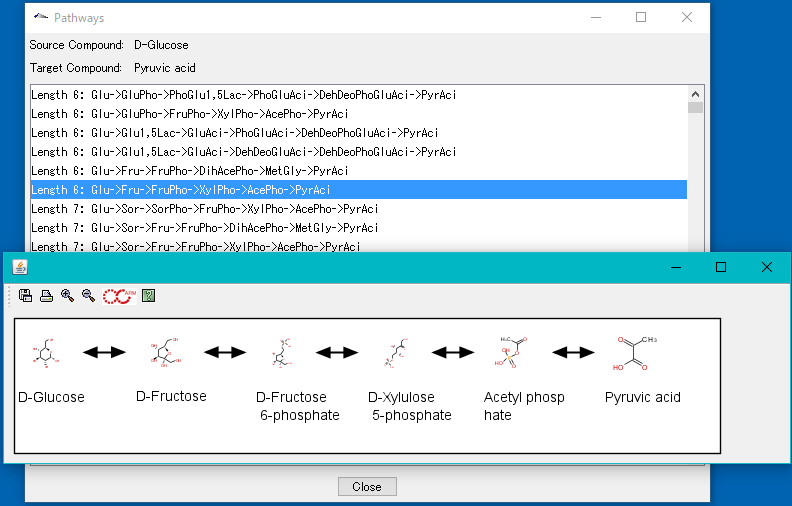
ARM is software developed by Prof. Arita of the University of Tokyo (present National Institute of Genetics).
Pair2Fragment 0
We convert NGS 's paired end read into fragments.
GenBank GBFF Expander 2
GenBank GBFF Expander is a tool to expand NCBI's GBFF format file containing a large number of genome sequences into individual genomic sequences and place them in the tree directory according to the Taxomy.
It is a prototype of TaxiSpider.
GenBank File Checker 0
This function checks whether the GenBank EMBL format file, which is the main format of the genome base sequence file used in IMC, is correct, and corrects it automatically if there are errors.
Storing multiple GenBank EMBL files under one directory will check all the files there.
In addition, the inspection result file can be saved in a different directory.
GenomeTraveler: Functions and Operations 0
Here we summarize the functions and operations of the genome Traveler.
It may overlap with description of each function.
Management of Data and Project 0
GT's data management and project management is explained.
Pre-Processing of NGS Data 0
Pre-processing of NGS data is explained.
de nove Assembly 0
GT's de novo assembly is explained.
NGS Reads Mapping 0
GT's NGS reads mapping is explained.
GT Alignment Viewer 0
GT's Alignment Viewer is explained.
Secondary Analysis 0
GT's secondary analysis is explained.
Scaffolding 0
Explaining the scaffolding function of GenomeTraveler.
Download 2
Technical Info 5
Training 0
IMC and GT workshops and training information.
Store 11
Interesting 0
IMC has such interesting functions.
Forum 1
Forum in silico, operated by in silico biology inc. provides places for questions, opinions, requests, discussions on products.
Tutorial 1
Homology Search 0
Tutorial about Homology Search.
Alignment 0
Tutorial about Alignment.
Cloning 1
Tutorial related Cloning.
Restriction Enzyme 0
Explain how to operate such as restriction enzyme registration, editing, narrowing down, digestion cutting, addition of recognition sequence.
Reverse Complement 0
This is a tutorial on reverse complementary strand or sequence related operation methods.
Genome Annotation 0
Here are tutorials for "Genome Annotation"
Tools 0
Tutorials of various Tools in IMC.
Sequence Pattern 0
Register the patterns of base sequences and amino acid sequences and search them in the genome sequences and CDS on them.
Sequence Data Handling 0
Tutorials on the handling of base sequence and amino acid sequence.
Primer Design 0
Tutorials related to primer design.
DIY Biology 0
Do It Yourself functions for biology.
We have various functions that anyone can design and build genomes.
Do It Yourself Biology Tools 0
Tools for genome analysis by your self.
Do It Yourself Tools for High School Students 0
Tools and data available for high school students interested in molecular biology.
To what extent is knowledge necessary to use these tools and data as a whole?
Do It Yourself Biology, Definition, Conditions, Requirements, Tools 0
Do It Yourself Biology, definition, conditions, elements, requirements, tools