Function Menu
 License Activation
 Function Overviews and Basic Operation
 Work Bench
 Feature Map
- Feature Key and Feature
 Management and Operations of Feature Keys
- Attributes of Feature Keys
- IMC Original Set Feature Keys
- Types and Roles of Qualifiers
- IMC Original Set Qualifiers
- View and Edit Qualifiers
- Feature Position on Genome Sequence
- Feature Fragmentation
- Feature Synthesis
- Feature Fusion
- Feature Operators
- Link and Refer on Feature
- Feature Mapping
- Register, Edit, Delete Feature
- Feature Appearance
- Join and Delete Position
- Feature Categorization and Presentation
- Import Feature
- Export Feature
- Numbering of Feature
 Sequence and Data Input and Output
- Genome / Sequence Viewer / Editor
 GenBank EMBL Viewer
 Sequence Viewer
 Annotation Viewer
- Multiple Genome Viewer (Linear Map)
 Circular Genome Viewer-Designer
 Plasmid Map Viewer-Designer
 Trace Viewer - Editor
- Labeling and Coloring
- Description Window
- Amino Acid Sequence Profile Viewer
- Multiple Alignment Viewer
 Phylogenetic Tree Viewer
- GT Alignment Viewer
- Restriction Enzyme Map Window
 Search Sequence and Annotation
- Cloning
- Sequencing
- Gene and Genome Sequence Analysis
- Genome Annotation
 Genome Comparison
- Multiple Aligment
- Phylogenetic Tree
- Multiple Linear Genome Map
- Gene Cluster Alignment
 Multiple Circular Genome Map
 Dot Plot Analysis
 Venn Diagram Analysis
- Core Genome Analysis
- Global Genome Rearrangement Analysis
- Local Genome Rearrangement Analysis
- Mutation Analysis
- Enzyme Alignment by EC Number
- Unique Region Analysis
- Genome Mapping
- Expression Analysis
- Metabolome Analysis
- Genome Design
 Settings
- Tools
- Window and Dialog Description
- What is "Do It Yourself" Genome Analysis Software?
- Functions and Operations of GenomeTraveler
 Dongle License (HW Key)
 Feature Key Search
 Keyword Search
 Pattern Search
 Priming Site Search
 Batch Homology Search
 Restriction Enzyme
 Primer Design
 PCR Reaction
 Ligation
 Fragment Modification
 DNA Content Analysis
 Codon Analysis
 ORF Analysis
 Database Management
 Reverse Complement
IMC W161F Expression Profile Lane Style Setting Dialog Description
Expression profile Lane style setting dialog. It can be set independently for each lane.
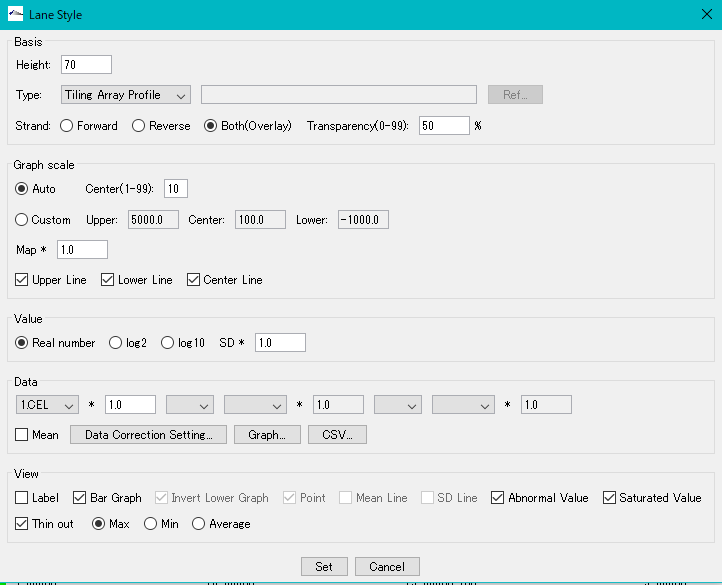
Basis section:
Height text field: Enter the height of the lane as a positive integer value. The unit is pixel.Height text field: Enter the height of the lane as a positive integer value. The unit is pixel.
Type pull-down menu: Select the format of the data. There are two types, Tiling Array Profile and Import Array Data.
Type text field: When Import Array Data is selected, enter the full path of the file storage location.
Rel ... button: Button for starting the file selection dialog.
Strand Forward radio button: When on, only data on the Forward strand will be displayed.
Strand Reverse radio button: When on, only data on Reverse strand is displayed.
Strand Both (Overlay) radio button: When on, data on both strands are overlapped and displayed.
Strand Transparency (0-99) Text field: Specify the transparency of the data to be overlaid. Enter an integer from 0 to 99.
Graph Scale section
Auto radio button: When on, sets the maximum value and minimum value of data in the display range to the upper and lower limit values of the display area.
Center (1-99) Text field: Enter the center line as the distance ratio from the lower limit value to the lane height. Enter an integer from 1 to 99.
Custom radio button: When on, the upper limit, lower limit, and median of the lane can be specified as arbitrary numerical values.
Upper text field: Enter the upper limit value of the lane as a real number.
Center text field: Enter the center line of the lane as a real number.
Lower text field: Enter the lower limit value of the lane as a real number.
Map * Text field: Multiply the profile value displayed on the lane by the entered value. Enter a real number greater than zero.
Upper Line check box: When checked, the upper line of the lane will be displayed.
Lower Line check box: When checked, displays the lower limit line of the lane.
Center Line check box: If checked, displays the center line of the lane.
Value section
Read Number radio button: When on, the expression level is displayed as it is.
Log 2 radio button: When on, the expression level is displayed in base 2 logarithm.
Log 10 Radio Button: When on, displays the expression level in base 10 logarithm.
SD * text field: Enter the coefficient multiplied by the standard deviation as a positive real number.
Data section
Define operations between up to three data series and display the value of the calculation formula.
Section 1 pull-down menu: b Select from the list of loaded array data.
* First term coefficient text field: First term Enter the coefficient multiplied by the data series as a real number.
Operator between 1st and 2nd terms pull-down menu: Select the first term data series and second term data series operators.
Section 2 pull-down menu: Select from the list of loaded array data.
* 2nd coefficient coefficient text field: 2nd term Enter the coefficient multiplied by the data series as a real number.
From 2nd to 3rd operators Operator pull-down menu: Select the first term data series and second term data series operators.
Paragraph 3 Pull-down menu: Select from the list of loaded array data.
* Paragraph 3 Coefficient text field: First term Enter the coefficient multiplied by the data series as a real number.
Mean check box: If checked, the operator setting in the above expression is ignored and the average value of the selected series is displayed.
Data Correction Setting ... Pull-down menu: Sets the data correction method for the value of the equation.
Graph ... button: Displays the value of an arithmetic expression as a histogram.
CSV ... button: Save the value of the formula as a CSV format file.
View section
Label check box: If checked, displays the data series file name as a label.
Bar check box: When checked, a bar graph will be displayed.
Invert Lower Graph checkbox: Selectable when Strand of Basic section is Reverse. When checked, the maximum and minimum values are displayed in reverse.
Point checkbox: Points to each value of the data series.
Mean Line check box: If checked, connect the average value of the data series with a polygonal line.
SD Line check box: When checked, connect the standard deviation of the data series with a polygonal line.
Abnormal Value check box: If checked, it will be displayed including abnormal values.
Saturated Value check box: When checked, displays saturated value.
Thin Out check box: When checked, it will make one graph rendered on the same pixel.
Max radio button: When on, displays the maximum value among the values drawn on the same pixel.
Min radio button: When on, displays the minimum value among the values drawn on the same pixel.
Average radio button: When on, displays the average value of the values drawn on the same pixel.
Set button: Confirms the change contents.
Cancel button: Cancel the setting contents.
.