Function Menu
 License Activation
 Function Overviews and Basic Operation
 Work Bench
 Feature Map
- Feature Key and Feature
 Management and Operations of Feature Keys
- Attributes of Feature Keys
- IMC Original Set Feature Keys
- Types and Roles of Qualifiers
- IMC Original Set Qualifiers
- View and Edit Qualifiers
- Feature Position on Genome Sequence
- Feature Fragmentation
- Feature Synthesis
- Feature Fusion
- Feature Operators
- Link and Refer on Feature
- Feature Mapping
- Register, Edit, Delete Feature
- Feature Appearance
- Join and Delete Position
- Feature Categorization and Presentation
- Import Feature
- Export Feature
- Numbering of Feature
 Sequence and Data Input and Output
- Genome / Sequence Viewer / Editor
 GenBank EMBL Viewer
 Sequence Viewer
 Annotation Viewer
- Multiple Genome Viewer (Linear Map)
 Circular Genome Viewer-Designer
 Plasmid Map Viewer-Designer
 Trace Viewer - Editor
- Labeling and Coloring
- Description Window
- Amino Acid Sequence Profile Viewer
- Multiple Alignment Viewer
 Phylogenetic Tree Viewer
- GT Alignment Viewer
- Restriction Enzyme Map Window
 Search Sequence and Annotation
- Cloning
- Sequencing
- Gene and Genome Sequence Analysis
- Genome Annotation
 Genome Comparison
- Multiple Aligment
- Phylogenetic Tree
- Multiple Linear Genome Map
- Gene Cluster Alignment
 Multiple Circular Genome Map
 Dot Plot Analysis
 Venn Diagram Analysis
- Core Genome Analysis
- Global Genome Rearrangement Analysis
- Local Genome Rearrangement Analysis
- Mutation Analysis
- Enzyme Alignment by EC Number
- Unique Region Analysis
- Genome Mapping
- Expression Analysis
- Metabolome Analysis
- Genome Design
 Settings
- Tools
- Window and Dialog Description
- What is "Do It Yourself" Genome Analysis Software?
- Functions and Operations of GenomeTraveler
 Dongle License (HW Key)
 Feature Key Search
 Keyword Search
 Pattern Search
 Priming Site Search
 Batch Homology Search
 Restriction Enzyme
 Primer Design
 PCR Reaction
 Ligation
 Fragment Modification
 DNA Content Analysis
 Codon Analysis
 ORF Analysis
 Database Management
 Reverse Complement
IMC O03B Features on XY Axis of DotPlot
You can display the features registered in each genome sequence on the XY axis of DotPlot.
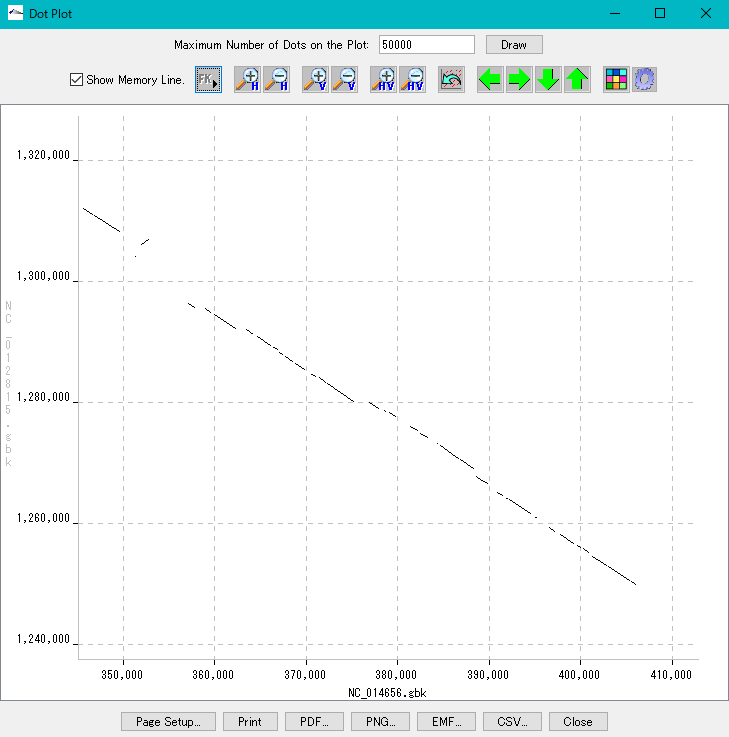
In the DotPlot result dialog, click the FK button in the button tool at the top.
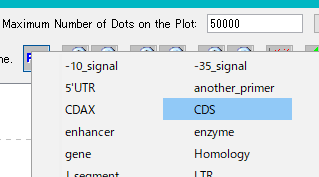
If no features are displayed, right-click the FK button.
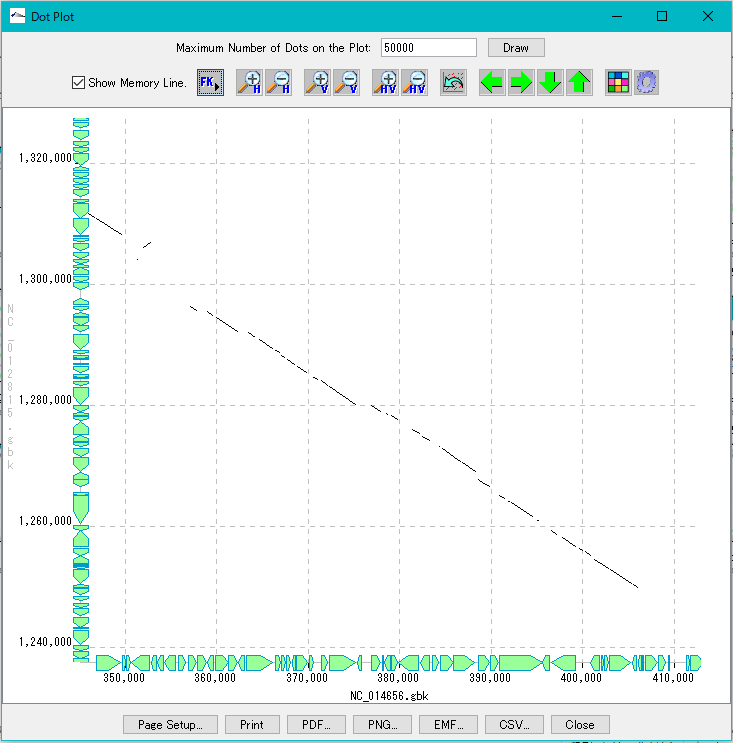
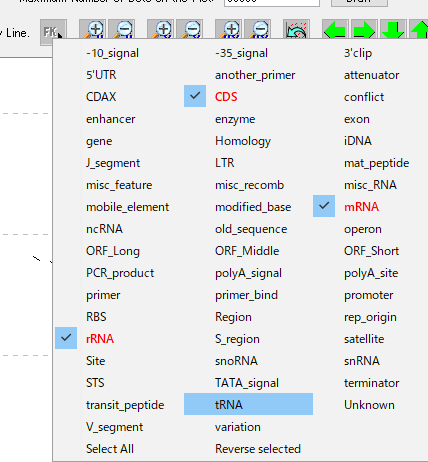
A list of Feature Keys appears on the menu, so select the Featrure Key to display.
To select more than one Feature Key, repeat this operation.
Features are displayed on the X and Y axes.
Zoom in if the scale is too large and the individual features are connected.