Function Menu
 License Activation
 Function Overviews and Basic Operation
 Work Bench
 Feature Map
- Feature Key and Feature
 Management and Operations of Feature Keys
- Attributes of Feature Keys
- IMC Original Set Feature Keys
- Types and Roles of Qualifiers
- IMC Original Set Qualifiers
- View and Edit Qualifiers
- Feature Position on Genome Sequence
- Feature Fragmentation
- Feature Synthesis
- Feature Fusion
- Feature Operators
- Link and Refer on Feature
- Feature Mapping
- Register, Edit, Delete Feature
- Feature Appearance
- Join and Delete Position
- Feature Categorization and Presentation
- Import Feature
- Export Feature
- Numbering of Feature
 Sequence and Data Input and Output
- Genome / Sequence Viewer / Editor
 GenBank EMBL Viewer
 Sequence Viewer
 Annotation Viewer
- Multiple Genome Viewer (Linear Map)
 Circular Genome Viewer-Designer
 Plasmid Map Viewer-Designer
 Trace Viewer - Editor
- Labeling and Coloring
- Description Window
- Amino Acid Sequence Profile Viewer
- Multiple Alignment Viewer
 Phylogenetic Tree Viewer
- GT Alignment Viewer
- Restriction Enzyme Map Window
 Search Sequence and Annotation
- Cloning
- Sequencing
- Gene and Genome Sequence Analysis
- Genome Annotation
 Genome Comparison
- Multiple Aligment
- Phylogenetic Tree
- Multiple Linear Genome Map
- Gene Cluster Alignment
 Multiple Circular Genome Map
 Dot Plot Analysis
 Venn Diagram Analysis
- Core Genome Analysis
- Global Genome Rearrangement Analysis
- Local Genome Rearrangement Analysis
- Mutation Analysis
- Enzyme Alignment by EC Number
- Unique Region Analysis
- Genome Mapping
- Expression Analysis
- Metabolome Analysis
- Genome Design
 Settings
- Tools
- Window and Dialog Description
- What is "Do It Yourself" Genome Analysis Software?
- Functions and Operations of GenomeTraveler
 Dongle License (HW Key)
 Feature Key Search
 Keyword Search
 Pattern Search
 Priming Site Search
 Batch Homology Search
 Restriction Enzyme
 Primer Design
 PCR Reaction
 Ligation
 Fragment Modification
 DNA Content Analysis
 Codon Analysis
 ORF Analysis
 Database Management
 Reverse Complement
IMC J02D Draw Content / Profile Graph of Genomes on one screen
Draw a GC content of the current genome sequence and a profile (multiple specifications possible) such as GC skew in a window.
Draw different profiles of multiple genomes with different genome base lengths on one canvas.
Operation
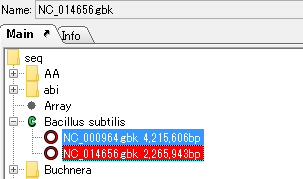
Load the genome sequence for drawing the content profile in the main current directory and select (multiple selection possible).
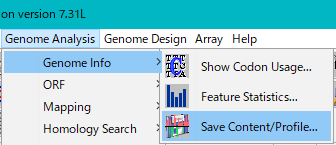
Click "Genome Analysis -> Genome Info -> Show Content / Profile Graph" from the menu.
(Click "File -> Save Content / Profile .." until IMC Version 7.30)
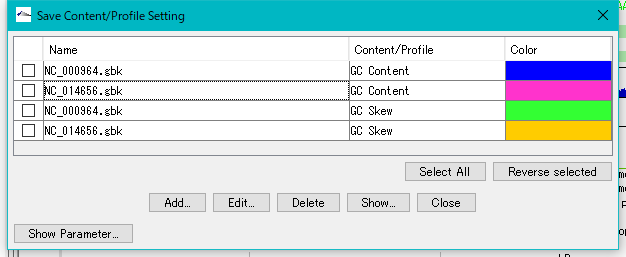
The "Content / Profile Graph Setting" dialog is displayed.
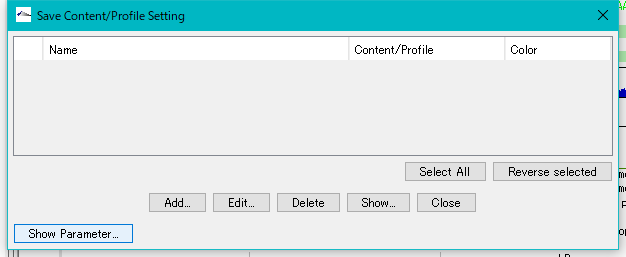
Click "Show Parameter" to enlarge the dialog, and the parameter setting area will be displayed.
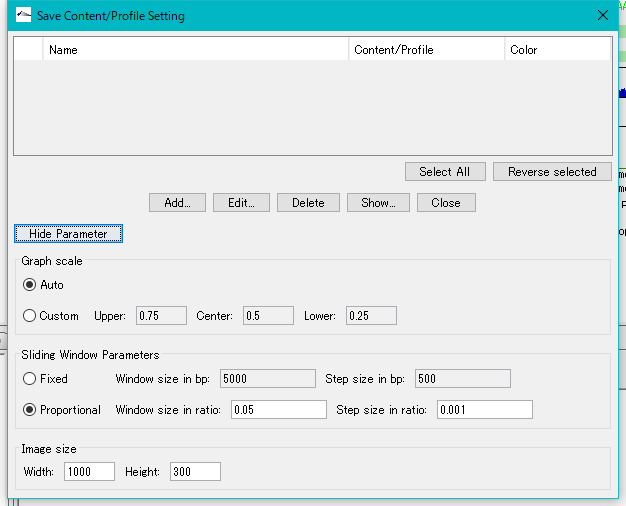
Click "Hide Parameter" to hide the parameter setting area.
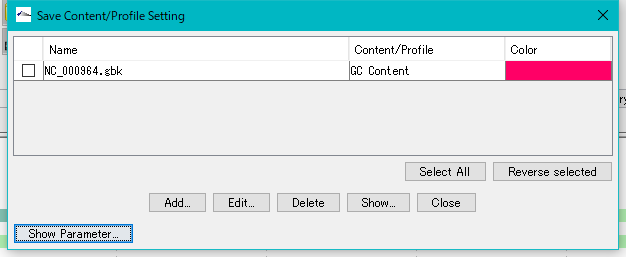
Click "Add".
The "Add Content / Profile Data" dialog is displayed.
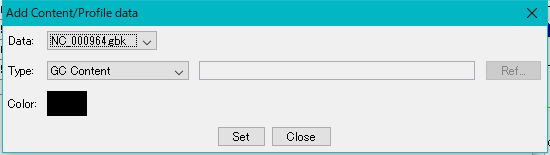
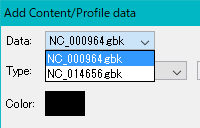
Select a genome from the "Data" pull-down menu.
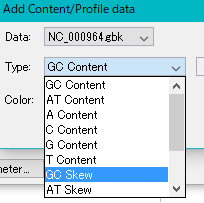
From the Type pull-down menu, select a content / profile to draw.
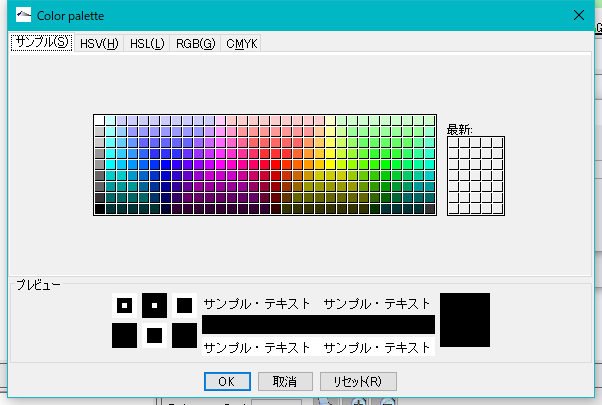
Click the "Color" box and select a drawing color.
Click "Set".
The content / profile to be drawn in the "Content / Profile Graph Setting" dialog is added.
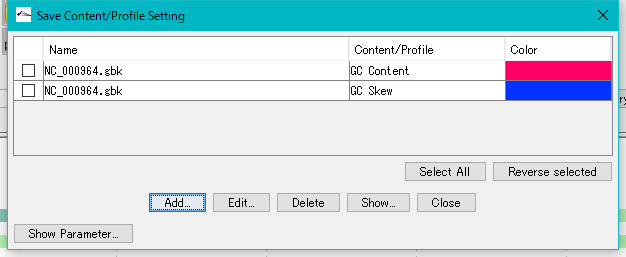
Add another content profile.
Click "Show".
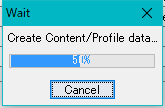
Processing starts.
A progress message is displayed during execution.
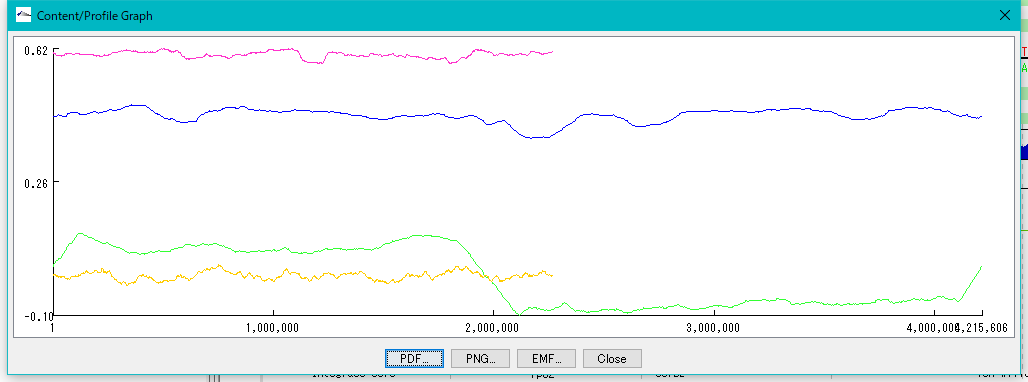
When processing is completed, the "Content / Profile Graph" window is displayed and the specified content profiles are drawn.
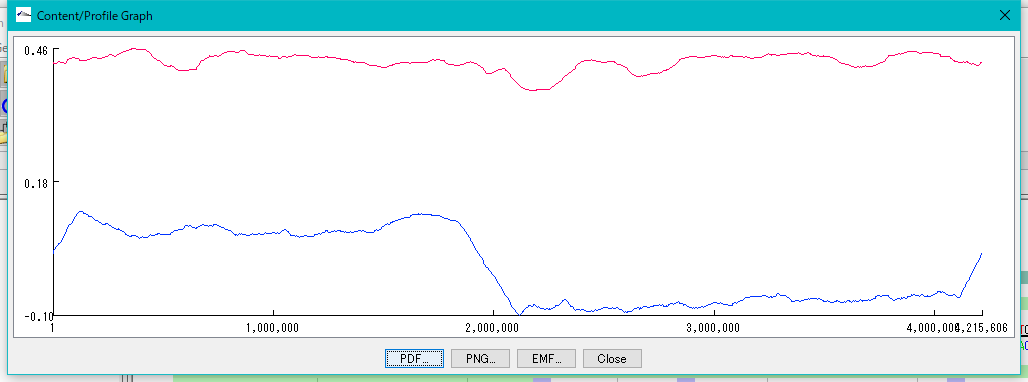
This image can be saved as a file.
You can add as many content profiles as you like.
Content / profiles of different genomes can also be drawn on the same screen.