Function Menu
 License Activation
 Function Overviews and Basic Operation
 Work Bench
 Feature Map
- Feature Key and Feature
 Management and Operations of Feature Keys
- Attributes of Feature Keys
- IMC Original Set Feature Keys
- Types and Roles of Qualifiers
- IMC Original Set Qualifiers
- View and Edit Qualifiers
- Feature Position on Genome Sequence
- Feature Fragmentation
- Feature Synthesis
- Feature Fusion
- Feature Operators
- Link and Refer on Feature
- Feature Mapping
- Register, Edit, Delete Feature
- Feature Appearance
- Join and Delete Position
- Feature Categorization and Presentation
- Import Feature
- Export Feature
- Numbering of Feature
 Sequence and Data Input and Output
- Genome / Sequence Viewer / Editor
 GenBank EMBL Viewer
 Sequence Viewer
 Annotation Viewer
- Multiple Genome Viewer (Linear Map)
 Circular Genome Viewer-Designer
 Plasmid Map Viewer-Designer
 Trace Viewer - Editor
- Labeling and Coloring
- Description Window
- Amino Acid Sequence Profile Viewer
- Multiple Alignment Viewer
 Phylogenetic Tree Viewer
- GT Alignment Viewer
- Restriction Enzyme Map Window
 Search Sequence and Annotation
- Cloning
- Sequencing
- Gene and Genome Sequence Analysis
- Genome Annotation
 Genome Comparison
- Multiple Aligment
- Phylogenetic Tree
- Multiple Linear Genome Map
- Gene Cluster Alignment
 Multiple Circular Genome Map
 Dot Plot Analysis
 Venn Diagram Analysis
- Core Genome Analysis
- Global Genome Rearrangement Analysis
- Local Genome Rearrangement Analysis
- Mutation Analysis
- Enzyme Alignment by EC Number
- Unique Region Analysis
- Genome Mapping
- Expression Analysis
- Metabolome Analysis
- Genome Design
 Settings
- Tools
- Window and Dialog Description
- What is "Do It Yourself" Genome Analysis Software?
- Functions and Operations of GenomeTraveler
 Dongle License (HW Key)
 Feature Key Search
 Keyword Search
 Pattern Search
 Priming Site Search
 Batch Homology Search
 Restriction Enzyme
 Primer Design
 PCR Reaction
 Ligation
 Fragment Modification
 DNA Content Analysis
 Codon Analysis
 ORF Analysis
 Database Management
 Reverse Complement
IMC W723 Venn Diagram Tab Pane Description
In the Venn Diagram tab pane, set the parameters for drawing Venn Diagram
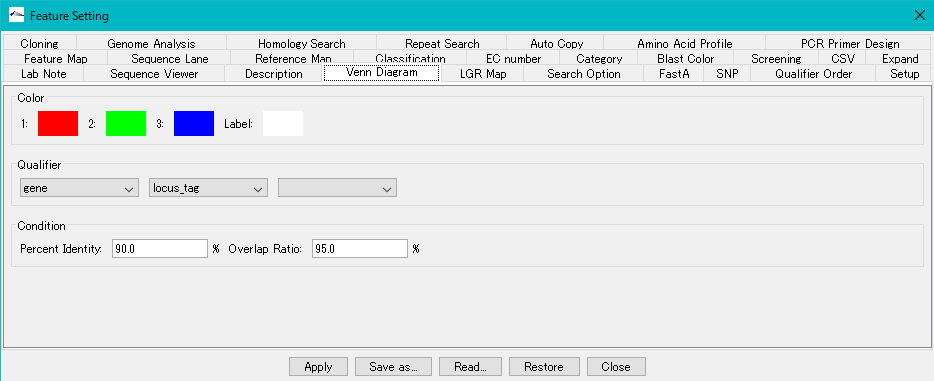
Color section:
You can change the rendering color of Venn Diagram.
Color Box 1: Set the fill color of the first circle.
Color Box 2: Set the fill color of the second circle.
Color Box 3: Set the fill color of the third circle.
Label color box: Specify the color of the label to draw inside each circle.
Qualifier section:
Venn Diagram Results List Select up to three Qualifiers to display in the dialog from each pull-down menu.
Condition section:
Venn Diagram determines genes common to two or three genomes. For judgment, use BBH (Best Binary Hit). The following conditions are used to judge whether to adopt a gene pair or triplet to be BBH.
Percent Identity text field: Enter a positive real number. Specify the percentage amino acid sequence identity in the alignment region of two or three BBHs as a percentage.
Overlap Ratio text field: Enter a positive real number. Specify the percentage of the total length of the residue length in the alignment region of two or three BBHs as a percentage.
For Feature Setting common operation buttons, please click here.