Function Menu
 License Activation
 Function Overviews and Basic Operation
 Work Bench
 Feature Map
- Feature Key and Feature
 Management and Operations of Feature Keys
- Attributes of Feature Keys
- IMC Original Set Feature Keys
- Types and Roles of Qualifiers
- IMC Original Set Qualifiers
- View and Edit Qualifiers
- Feature Position on Genome Sequence
- Feature Fragmentation
- Feature Synthesis
- Feature Fusion
- Feature Operators
- Link and Refer on Feature
- Feature Mapping
- Register, Edit, Delete Feature
- Feature Appearance
- Join and Delete Position
- Feature Categorization and Presentation
- Import Feature
- Export Feature
- Numbering of Feature
 Sequence and Data Input and Output
- Genome / Sequence Viewer / Editor
 GenBank EMBL Viewer
 Sequence Viewer
 Annotation Viewer
- Multiple Genome Viewer (Linear Map)
 Circular Genome Viewer-Designer
 Plasmid Map Viewer-Designer
 Trace Viewer - Editor
- Labeling and Coloring
- Description Window
- Amino Acid Sequence Profile Viewer
- Multiple Alignment Viewer
 Phylogenetic Tree Viewer
- GT Alignment Viewer
- Restriction Enzyme Map Window
 Search Sequence and Annotation
- Cloning
- Sequencing
- Gene and Genome Sequence Analysis
- Genome Annotation
 Genome Comparison
- Multiple Aligment
- Phylogenetic Tree
- Multiple Linear Genome Map
- Gene Cluster Alignment
 Multiple Circular Genome Map
 Dot Plot Analysis
 Venn Diagram Analysis
- Core Genome Analysis
- Global Genome Rearrangement Analysis
- Local Genome Rearrangement Analysis
- Mutation Analysis
- Enzyme Alignment by EC Number
- Unique Region Analysis
- Genome Mapping
- Expression Analysis
- Metabolome Analysis
- Genome Design
 Settings
- Tools
- Window and Dialog Description
- What is "Do It Yourself" Genome Analysis Software?
- Functions and Operations of GenomeTraveler
 Dongle License (HW Key)
 Feature Key Search
 Keyword Search
 Pattern Search
 Priming Site Search
 Batch Homology Search
 Restriction Enzyme
 Primer Design
 PCR Reaction
 Ligation
 Fragment Modification
 DNA Content Analysis
 Codon Analysis
 ORF Analysis
 Database Management
 Reverse Complement
View
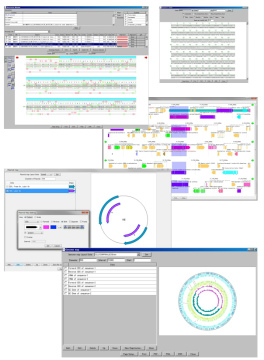 |
IMC has various display windows as follows.
|
Subcategories
GenBank EMBL Viewer 1
- A viewer that can view the currently loaded sequence file in its original format.
- When you click on an sequence or annotation, the main feature map will display a map of that position.
- Conversely, with this viewer open, you can click on a part of the main feature map to display the text at the corresponding position in the file.
Sequence Viewer 2
- A viewer that displays a sequence of the area currently displayed in the main feature map.
- You can display the display range on the viewer, show / hide the reverse strand, display / not display the amino acid translation, change the display method of the scale, display number of bases displayed.
- You can output image files in PDF, PNG, EMF format respectively.
Annotation Viewer / Editor 12
It is a viewer / editor prepared for genome annotation.
It is a window independent from the main window.
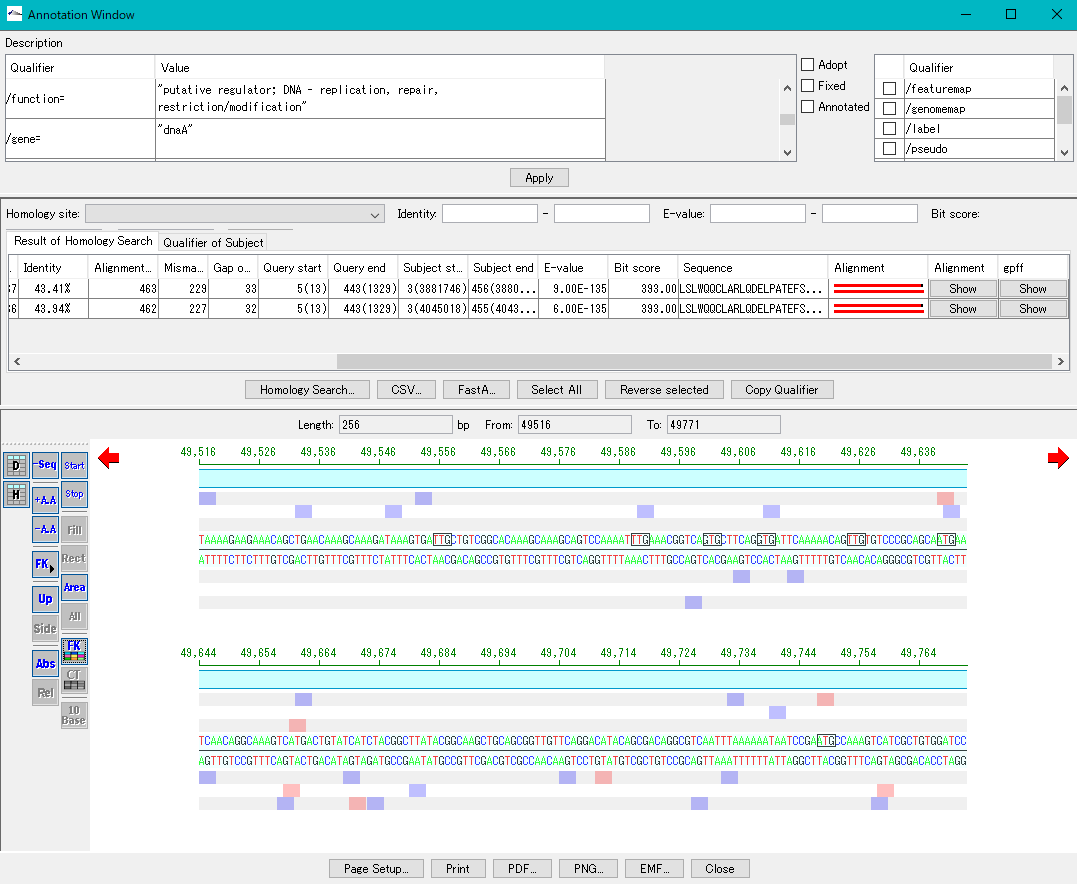
Viewer function
- Mainly used for annotating CDS.
- The window is divided into three parts, you can enter annotations directly, you can directly edit them, you can link the results of the homology search to the CDS features themselves and display them and post them.
- At the same time existing features can be selectively displayed in the array display area.
You can change the display settings for arrays, features, and tick marks. - Image contents can be output in PDF, PNG, EMF format.
- From this window you can also perform a homology search that queries this feature and the results are linked immediately.
Multiple Linear Genome Map Viewer 2
Multiple Linear Genome Map Viewer is a viewer that compares annotation such as genes of multiple closely related species genomes in parallel for each genome in parallel and is docked in the IMC main window.
We call aliases as linear genome map viewer, reference genome map, reference map etc.
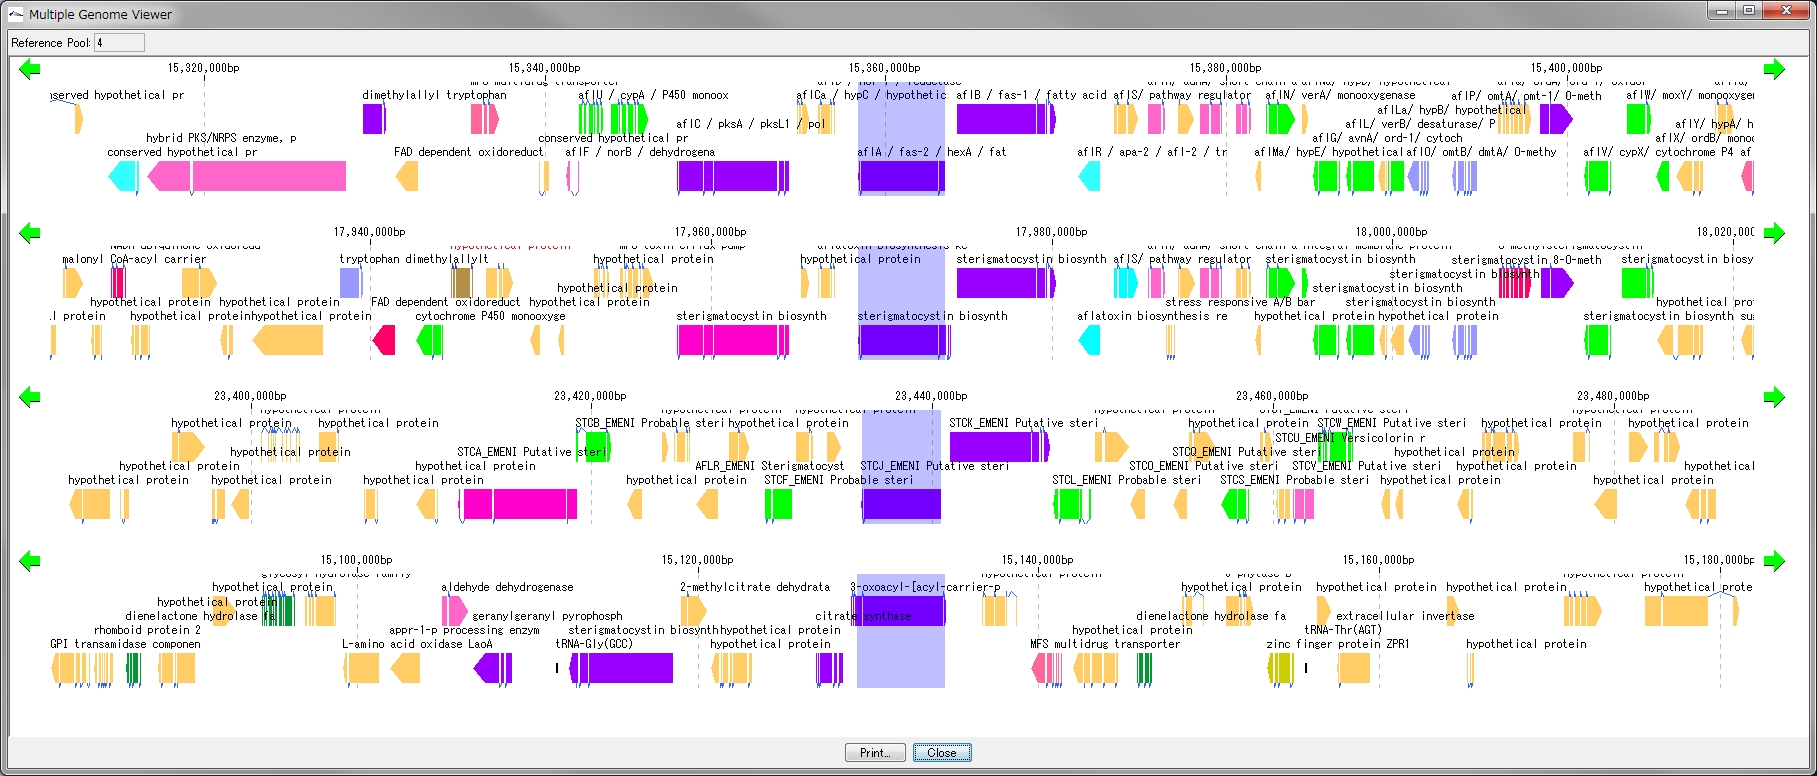
Viewer function
- You can dock out from the IMC main window and move and resize as an independent window.
- It can be linked with the main feature map.
- Homology searches can be performed on CDSs of other closely related genomes loaded from each CDS feature on a multiple linear genomic map.
- Gene cluster alignment can be performed to visualize the state of syntenic preservation near the ortholog gene.
- Change the genome display order using the corresponding reference directory.
- Map can be output as print or image file
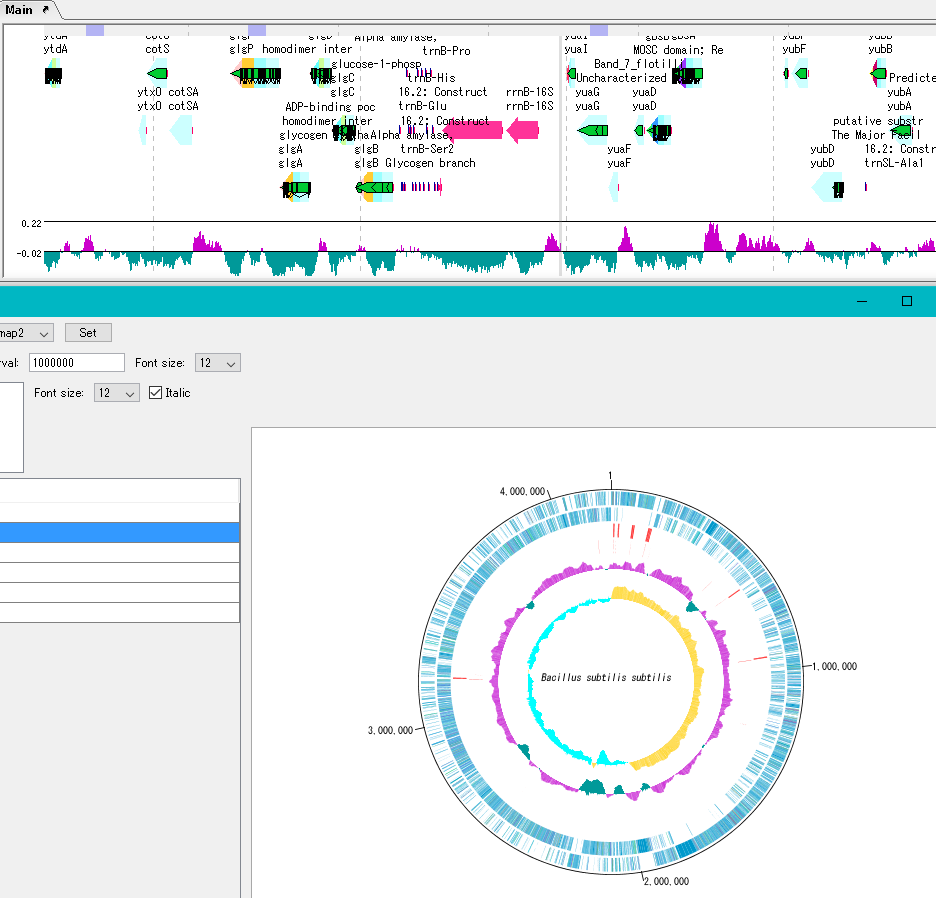
Circular Genome Viewer-Designer 9
Circular Genome Map (Circular Genome Map) is a function to compare and draw Features and Contents from arbitrary genomic chromosomes or genomic chromosomes of closely related species and arbitrary numerical data specific to genome position on concentric circles.
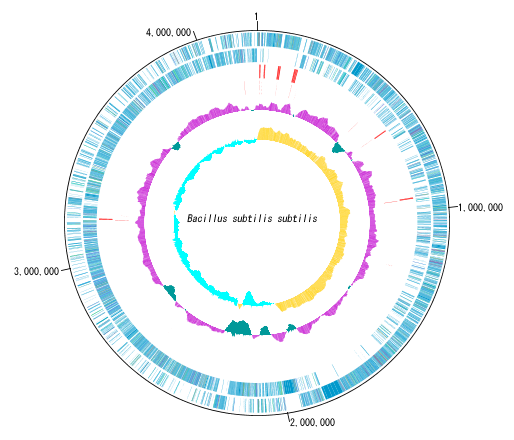
You can display distribution status of each gene such as genes of each genomic chromosome, change of base composition, etc.
The order of concentric circles of features and content profiles to be placed can be changed arbitrarily.
Drawing parameter setting can be changed for each concentric circle.
It is also possible to change the diameter of the circular genome map and the printing parameters.
For printing a circular genome map, in addition to direct printing, you can output files in PDF, PNG, and EMF formats.
A large number of features drawn on the concentric circle of the circular genome map can be classified and displayed in different colors depending on the annotation type if there are annotations.
- Circular Feature Lane Different Feature drawing independent color setting is possible.
- Feature Key Draw with different colors.
- When Color Qualifier is set, draw the CDS Feature with the specified color.
- Draw the CDS Feature with the color specified in the Classification code.
- Draw the CDS Feature with color derived from EC Nubmer.
- Draw the CDS Feature with the color specified in the Category code.
- Draw the CDS Feature with the color specified in Blast's score range.
Sequence files drawn on the circular genome map are referenced in the order shown in the main current directory. For this reason it is easy to manipulate drawing a number of different circular genome sequences in the same format.
By clicking on a part of the circular genome map it is possible to display the area of the corresponding main feature map.
In the circular genome map, the sequence file name and total base length (when single genomic chromosome) are drawn at the center, and the base number scale is displayed around it.
The starting position base of the scale can also be changed.
The map layout can be registered as a layout style, and the registered circular genome layout style can be called later.
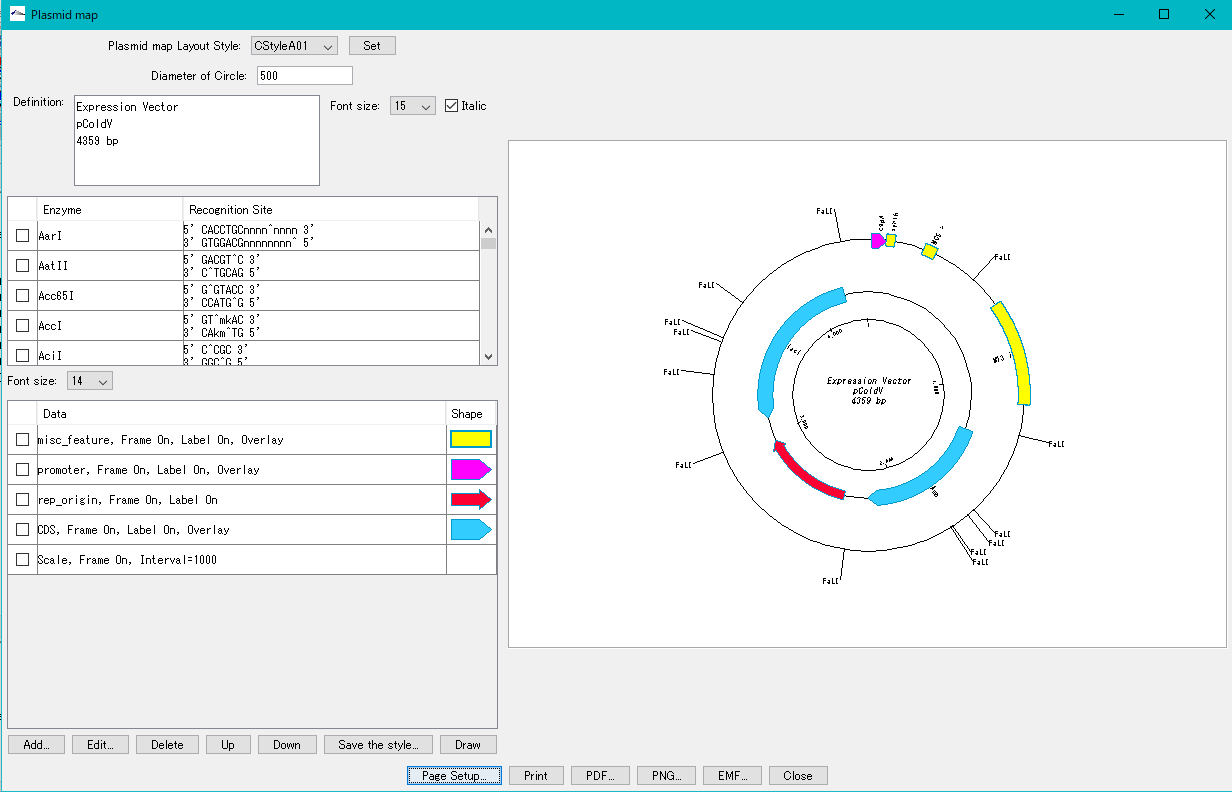
Plasmid Map Viewer - Designer 3
- It is similar to the circular genome map editor, but draws a relatively small circular genome.
- The annular lanes are arranged concentrically, and you can place multiple feature keys on one concentric circle.
- Strand, frame, feature shape, color designation of fill and frame, thickness of frame, selection of color classification, display / non-display of label, selection of Qualifier to be used as a label, font size, two concentric circle overlay functions ,
- You can change the scale interval.
- Designed styles can be saved and applied to other plasmids.
- You can change the order of concentric circles, add / delete, and edit.
- Plasmid maps can be output in three types of image formats: PDF, PNG, and EMF.
Trace Viewer - Editor 1
It is a viewer / editor which is used when reading output file from ABI, SCF capillary sequencer.
Displays not only the base sequence but also the trace waveform.
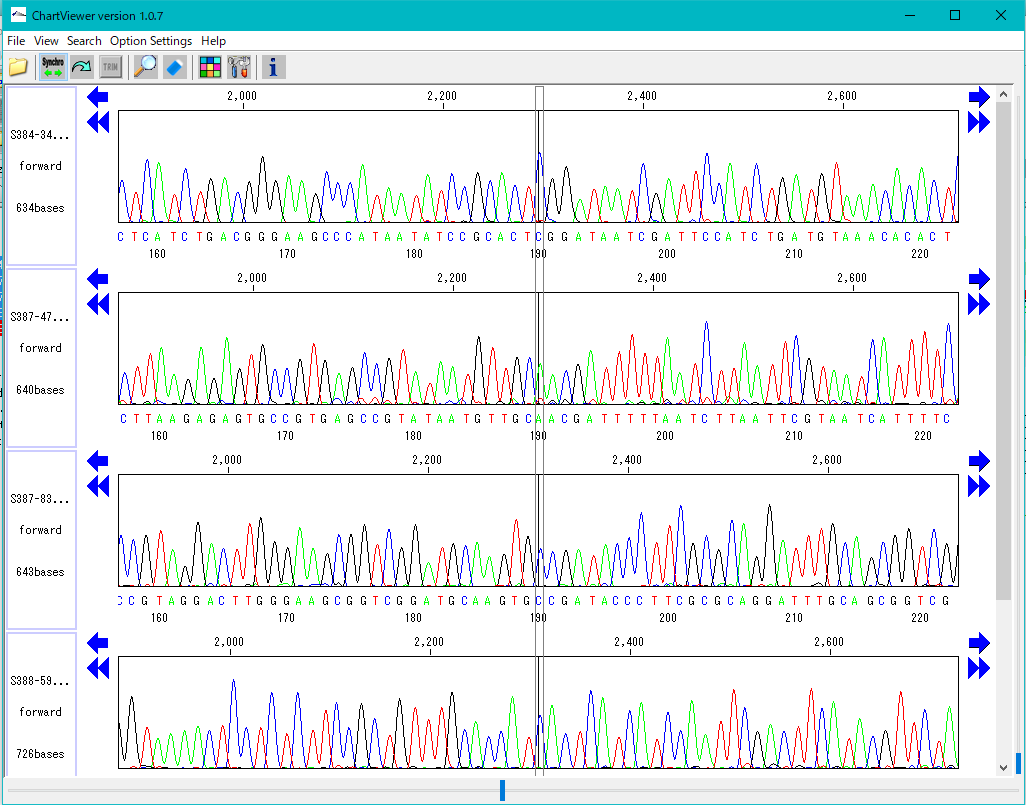
Function
- Multiple files can be displayed in parallel.
- It corresponds to ABI, SCF format file.
- It is displayed on a separate window separate from the main feature map.
- The trace waveform viewer window can be resized.
- You can change by dragging the display position of each waveform.
- You can change the height of the trace waveform display frame.
- You can change the display color by base.
- Each waveform can be scrolled horizontally independently.
- If the position of each trace waveform is aligned, you can scroll interlocking sideways.
- You can freely change the width and height of the trace waveform with the slider.
- You can search for restriction enzyme recognition sites and highlight sequences after searching.
- You can also start from Trace Mapping execution result.
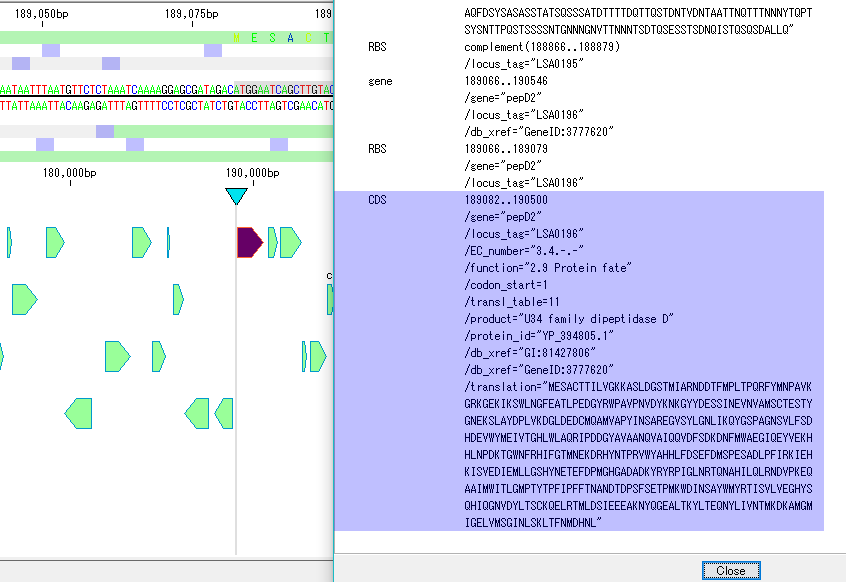
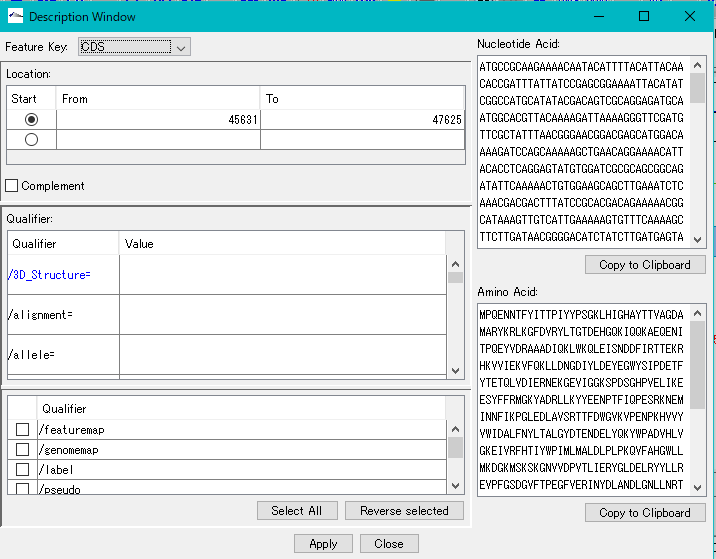
Description Window 2
The description window is a window for entering and editing values in the feature's Qualifier.
Launched with a right click on the feature and you can edit all the Qualifiers for that feature.
Change the Position of the feature.
Change the Feature Key to which the feature belongs.
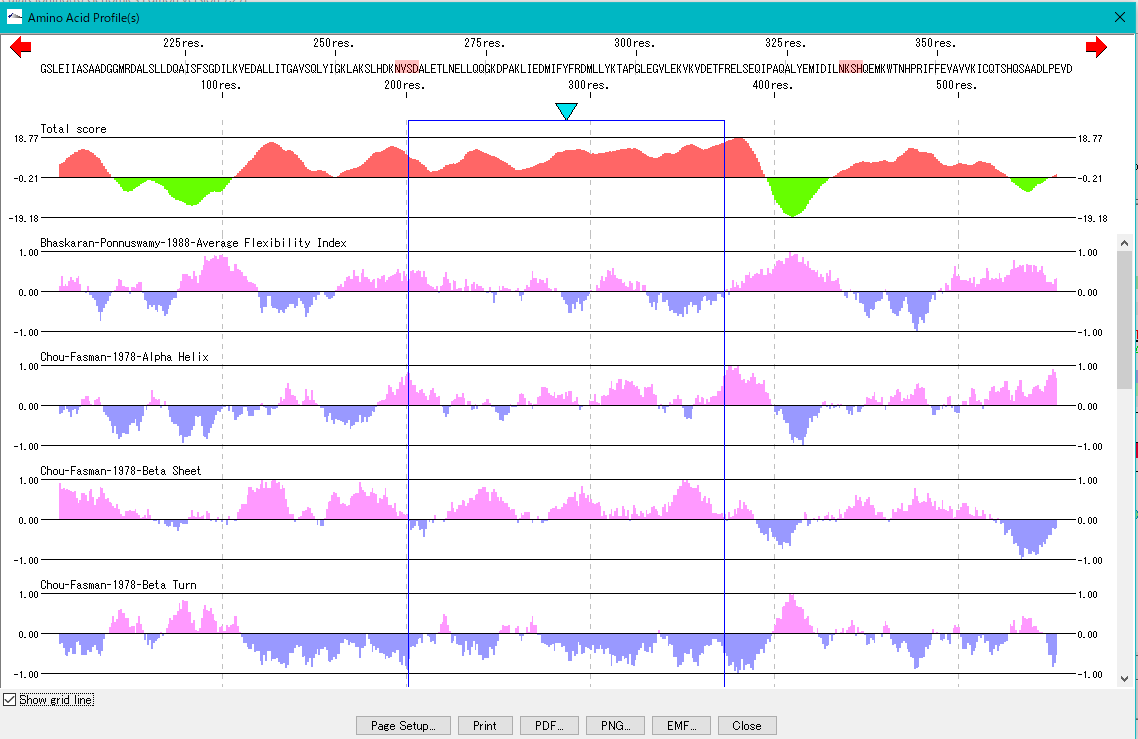
Amino Acid Sequence Profile Viewer 2
This is a viewer that displays profiles such as secondary structure of amino acid sequence in parallel. Total profile design and display, motif display and so on are possible.
Multiple Alignment Viewer 1
Multiple alignment viewer is a window for displaying multiple alignment of DNA sequences and amino acid sequences.
Multiple alignment viewer can be launched from homology search result dialog etc.
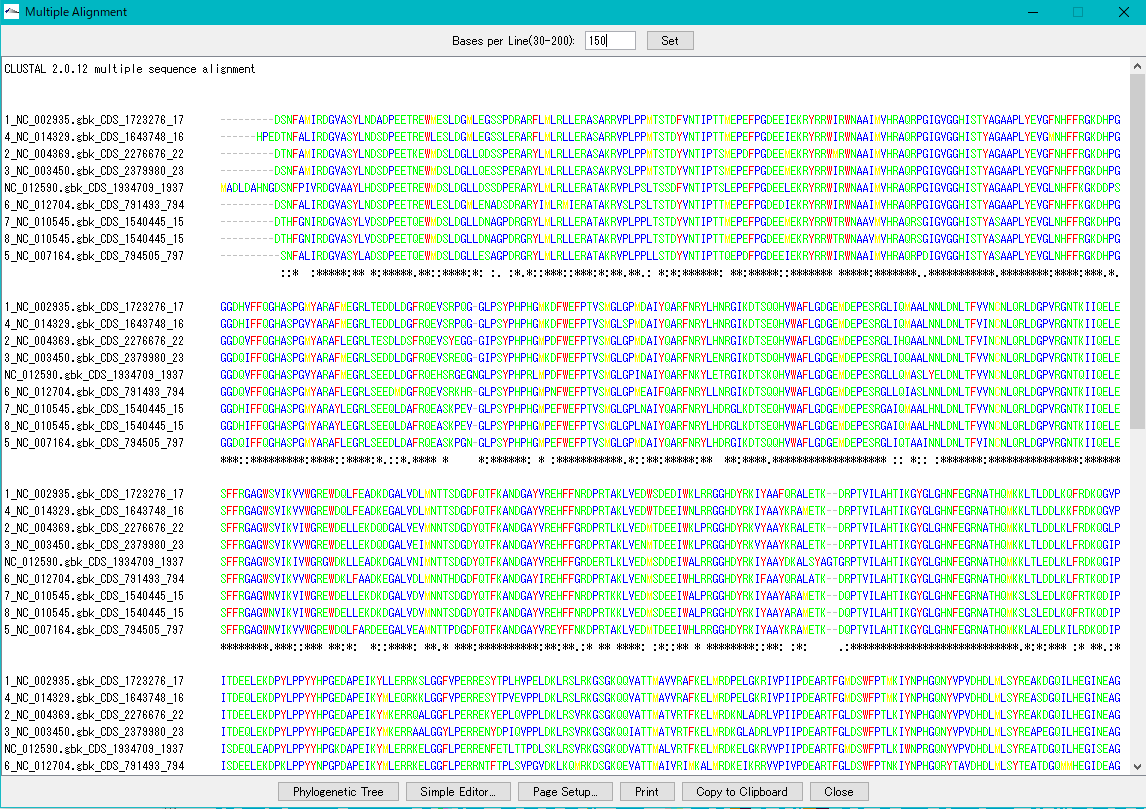
Viewer function
- Launch Phylogenetic Tree drawing dialog to draw molecular phylogenetic trees.
- Launch the simple editor of multiple alignment.
- Print the alignment chart. You can copy the alignment to the clipboard and use it with another software.
- Change the number of displayed bases and the number of residues on one line.
- Change the display color of bases and amino acids.
- For multiple alignment generation, CLUSTALW is used.
Phylogenetic Tree Viewer 1
Molecular phylogenetic tree viewer is a tool to draw molecular phylogenetic trees from sequences of such as genes.
This viewer can be launched from multiple alignment viewer.
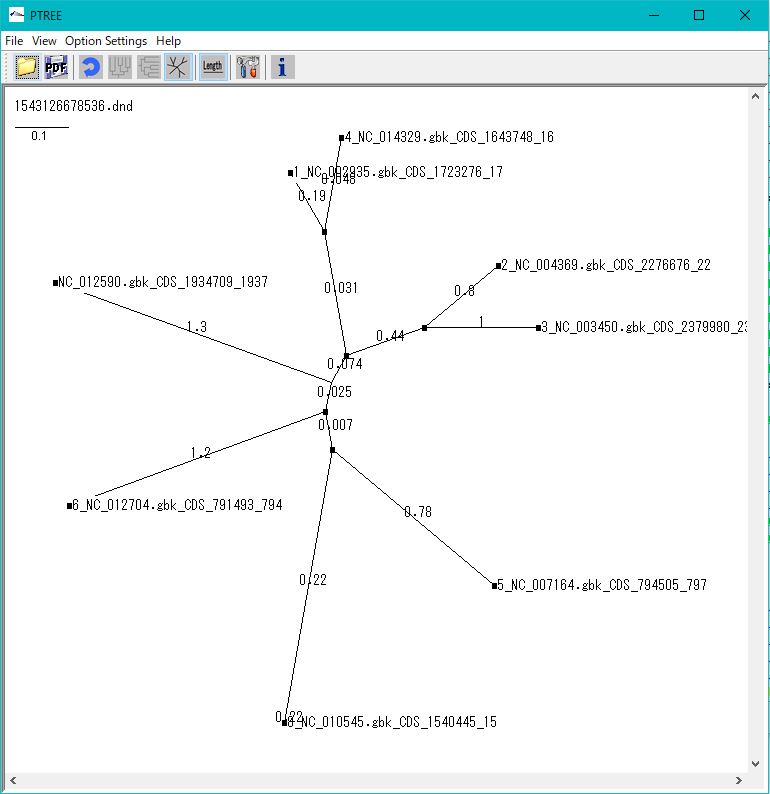
Viewer Function
- Draw rootless tree and rooted tree.
- DND format file can be loaded and rendered.
- Evolution distance can be displayed.
- Print and output image files.
GT Alignment Viewer 0
Alignment Viewer is a viewer editor that displays the primary analysis result of GT and executes secondary analysis etc.
Alignment Viewer can be launched from GT's main window.
The Alignment Viewer consists of a menu bar, a tool box, and four panes.
Although the menu bar is fixed in the Viewer window, the toolbox and the four panes can be removed from the window and displayed at any position on the desktop.
The toolbox can also be hidden.
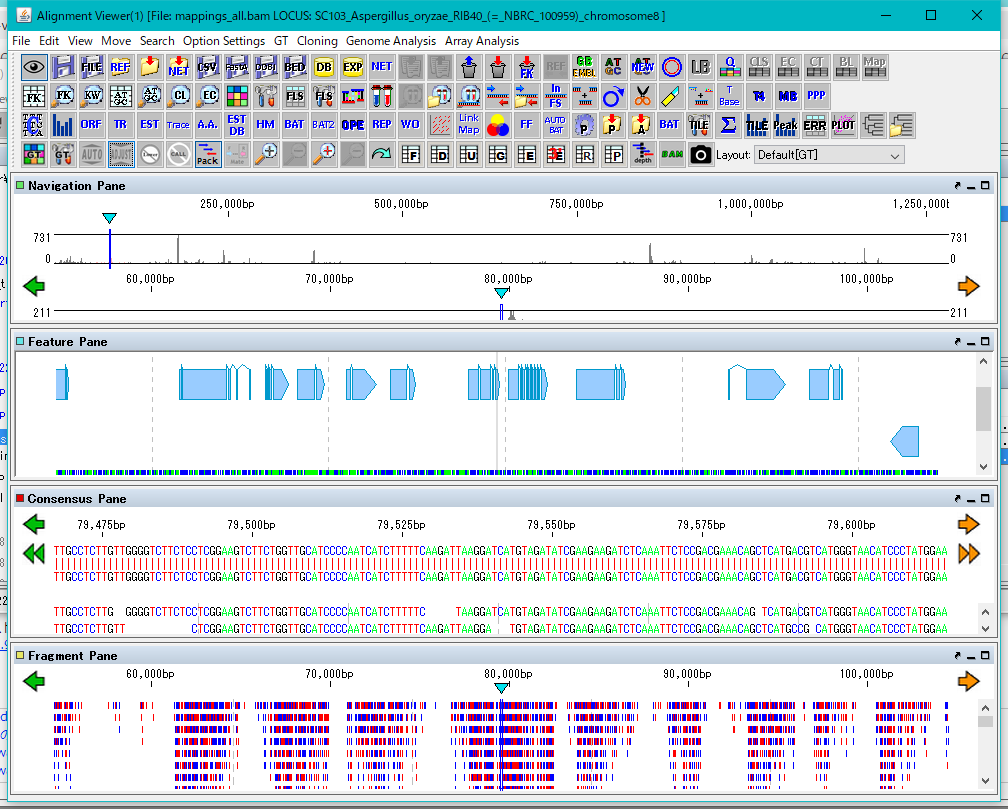
The four panes are named as Navigation Pane, Feature Pane, Consensus Pane and Fragment Pane from the top.
Navigation Pane is a special pane for navigating the other three panes and has a two-step scale of genome-wide scale and scale within the selected region.
Feature Pane has functions similar to IMC's main feature map and can perform most functions of IMC.
Consensus Pane is a function to display the Assembly result as a sequence alignment of Contig and Read constituting it, and a function to display the Mapping result as a sequence alignment of the reference genome sequence and Read.
Fragment Pane is a function to graphically display Consensus Pane, which allows you to view assemblies and mapping in a more bird's-eye view.
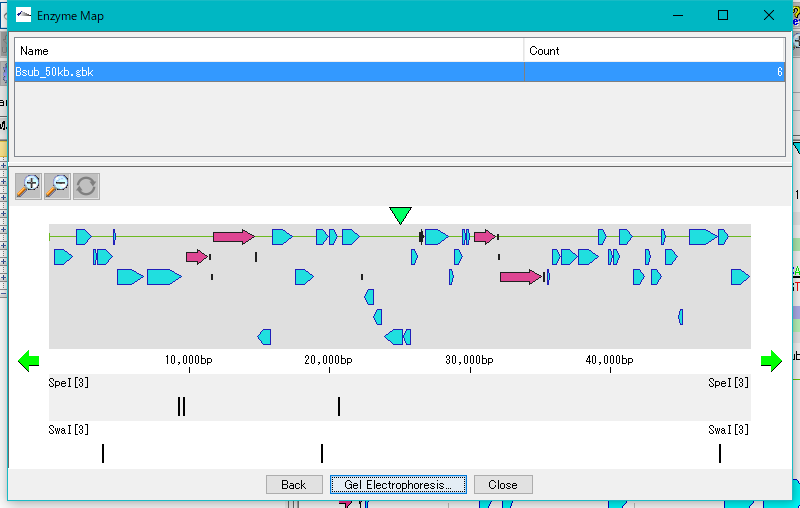
Restriction Enzyme Map Window 0
This is a window for drawing a restriction enzyme map.
It also draws a feature map similar to the main feature map.
Zoom, horizontal scroll, and gel electrophoresis diagrams are available.