Function Menu
 License Activation
 Function Overviews and Basic Operation
 Work Bench
 Feature Map
- Feature Key and Feature
 Management and Operations of Feature Keys
- Attributes of Feature Keys
- IMC Original Set Feature Keys
- Types and Roles of Qualifiers
- IMC Original Set Qualifiers
- View and Edit Qualifiers
- Feature Position on Genome Sequence
- Feature Fragmentation
- Feature Synthesis
- Feature Fusion
- Feature Operators
- Link and Refer on Feature
- Feature Mapping
- Register, Edit, Delete Feature
- Feature Appearance
- Join and Delete Position
- Feature Categorization and Presentation
- Import Feature
- Export Feature
- Numbering of Feature
 Sequence and Data Input and Output
- Genome / Sequence Viewer / Editor
 GenBank EMBL Viewer
 Sequence Viewer
 Annotation Viewer
- Multiple Genome Viewer (Linear Map)
 Circular Genome Viewer-Designer
 Plasmid Map Viewer-Designer
 Trace Viewer - Editor
- Labeling and Coloring
- Description Window
- Amino Acid Sequence Profile Viewer
- Multiple Alignment Viewer
 Phylogenetic Tree Viewer
- GT Alignment Viewer
- Restriction Enzyme Map Window
 Search Sequence and Annotation
- Cloning
- Sequencing
- Gene and Genome Sequence Analysis
- Genome Annotation
 Genome Comparison
- Multiple Aligment
- Phylogenetic Tree
- Multiple Linear Genome Map
- Gene Cluster Alignment
 Multiple Circular Genome Map
 Dot Plot Analysis
 Venn Diagram Analysis
- Core Genome Analysis
- Global Genome Rearrangement Analysis
- Local Genome Rearrangement Analysis
- Mutation Analysis
- Enzyme Alignment by EC Number
- Unique Region Analysis
- Genome Mapping
- Expression Analysis
- Metabolome Analysis
- Genome Design
 Settings
- Tools
- Window and Dialog Description
- What is "Do It Yourself" Genome Analysis Software?
- Functions and Operations of GenomeTraveler
 Dongle License (HW Key)
 Feature Key Search
 Keyword Search
 Pattern Search
 Priming Site Search
 Batch Homology Search
 Restriction Enzyme
 Primer Design
 PCR Reaction
 Ligation
 Fragment Modification
 DNA Content Analysis
 Codon Analysis
 ORF Analysis
 Database Management
 Reverse Complement
You are here: Home  Gene and Genome Sequence Analysis DNA Content Analysis IMC W161C Content Profile Lane Style Setting Dialog
IMC W161C Content Profile Lane Style Setting Dialog
It is a content / profile lane setting dialog.
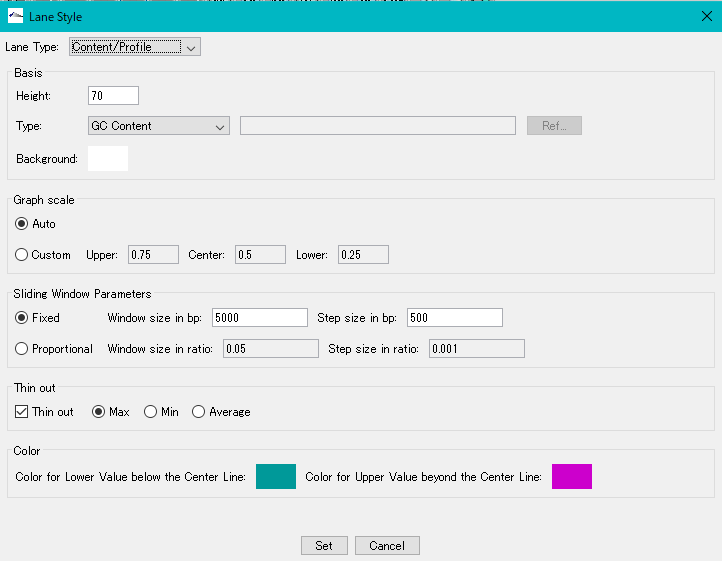
Basis:
- Height input field: Sets the height of the lane (unit pixels)
- Type pull-down menu: This is a menu for selecting a registered profile.
- Input field and Ref ... button: When "Import Map Data" is selected as Type, specify the file name with an absolute path. Alternatively, use the Ref ... button to display the file selection dialog and select the file.
- Background color box: Sets the background color of the profile lane.
Graph Scale:
- Auto radio button: Automatically sets the maximum, minimum and median of the graph.
- Custom radio button: Manually set the maximum, minimum and median of the graph.
Sliding Window Parameters:
Set sliding window parameters.
- Fixed radio button: When on, you can enter numerical values in the right input field.
- Window Size in bp In the input field, specify the window size of the sliding window in terms of the number of bases.
- Step Size in bp In the input field, specify the step size of the sliding window by the number of bases.
- Proportional radio button: When on, you can enter a numerical value in the right input field.
- Window Size in ratio In the input field, specify the window size of the sliding window as a ratio to the total base length of the current genome sequence.
- Step Size in ratio In the input field, specify the step size of the sliding window as a ratio to the total base length of the current genome sequence.
Thin Out:
This parameter is used to thin out the drawing when the line segment for drawing the profile overlaps the same position and is drawn.
- Max radio button: When on, only the maximum value is drawn in the same position numerical value.
- Min radio button: When on, draws only the minimum value in the same position numerical value.
- Average radio button: When on, the average value of the numerical value at the same position is drawn.
- Color: Numeric values can be displayed in different colors with values larger than the median and small values. Numbers that are larger than median go out from the center line and are drawn with a bar graph by that value. Numbers smaller than the median are drawn with a bar graph pointing downward from the center line.
- Color for Lower Value below the Center Line color box: Specifies the color of a bar graph with a smaller number than the median value.
- Color for Upper Value beyond the Center Line Color Box: Specifies the color of a bar graph with a larger number than the median value.